What Does Churned Mean in the Home Internet Broadband FTTH Industry? Managing Retention to Reduce Subscriber Loss

What does churned mean in the fiber-to-the-home (FTTH) broadband market?
One metric determines profitability more than any other: churn.
A single percentage point difference in monthly churn can cost an FTTH operator millions in lost lifetime value across thousands of subscribers. Yet many operators still treat churn as a byproduct of market competition rather than a strategic lever they can control.
This post defines what “churned” means in FTTH, explains why it matters to your bottom line, and shows how data-driven retention strategies can transform your growth trajectory. By the end, you’ll understand not just the mechanics of churn, but how to build a retention machine that protects your subscriber base and maximizes the ROI of your fiber network investment.
Understanding Churn — The Definition Every FTTH Operator Needs
Churn in telecommunications refers to the percentage of subscribers who cancel their service during a specific period—usually measured monthly or annually. A subscriber is marked as “churned” the moment they formally disconnect their service or fail to pay for a billing cycle (in involuntary churn scenarios).
In the FTTH industry, churn is expressed as a rate: the number of subscribers lost divided by the average number of active subscribers during that period.
Voluntary vs. Involuntary Churn
Not all churn is created equal. Voluntary churn occurs when subscribers actively choose to cancel service—they switch to a competitor, move out of the service area, or simply discontinue the service. Involuntary churn happens when subscribers lose service due to non-payment or technical issues beyond their control. FTTH operators typically track both separately because the retention strategies differ significantly.
Voluntary churn indicates competitive or service quality issues you can address. Involuntary churn points to billing systems, collections processes, or network reliability problems that require operational fixes.
Why FTTH Churn Differs from Mobile or Legacy Broadband
FTTH churn operates in a different ecosystem than mobile networks. Mobile subscribers often tolerate service disruptions because switching involves porting numbers and changing habits. FTTH subscribers face lower switching friction—they can activate competitor service within days if broadband alternatives exist. This makes FTTH markets more price-sensitive and experience-sensitive than wireless.
Legacy copper-based broadband (DSL, HSD) often carried higher natural switching costs (longer contracts, bundling lock-in). FTTH markets are typically more competitive because fiber is deployed in higher-density areas where multiple operators may exist, creating direct price and speed comparisons. Understanding this context is critical to setting realistic churn targets.
Why Churn Rate is the Most Critical KPI for FTTH ISPs
Churn is not just a customer retention metric—it is a financial lever that directly impacts every element of FTTH operator economics.
Customer lifetime value (CLV) is where churn’s impact becomes apparent. If your average subscriber pays $60/month and stays for 48 months, CLV is roughly $2,880 (before costs). If churn increases from 2% monthly (staying ~50 months) to 3% monthly (staying ~33 months), your CLV drops by 34%. That single percentage point difference transforms a profitable customer into a marginal one.
Churn also erodes ARPU (Average Revenue Per User) growth. New fiber subscribers typically upgrade to higher-tier plans over time—more bandwidth, bundled services, premium support. Churn intercepts this trajectory. A customer you lose in month 6 never reaches the tier 3 product you’d have sold them in month 18. This is why fiber ARPU growth strategies only work when paired with robust retention. You cannot grow revenue per user if customers leave before they upgrade.
From a network perspective, churn determines your payback period on fiber deployment. A fiber build costs $1,500–$2,500 per passable home in typical deployments. If churn forces you to replace 15% of your subscriber base annually, you’re perpetually reinvesting in acquisition rather than expanding to new areas. Operators with 2% monthly churn reach profitability 2–3 years faster than those at 3% monthly churn.
Competitive positioning is also affected. In saturated FTTH markets, churn becomes the differentiator. Two operators with identical speeds and pricing are separated only by service quality and retention performance. The one with 1.5% monthly churn wins market share; the one at 3% loses ground despite similar acquisition efforts.
How to Calculate and Measure FTTH Churn Rate

Churn appears simple on the surface—dividing subscribers lost by average subscribers—but measurement rigor matters for benchmarking and strategic decisions.
Standard Churn Calculation
The most common formula is:
Monthly Churn Rate (%) = (Subscribers Lost During Month / Average Active Subscribers During Month) × 100
Example: If you start the month with 10,000 subscribers, end with 9,700 (lost 300), your average is 9,850. Monthly churn = (300 / 9,850) × 100 = 3.05%.
Annualized churn is NOT simply monthly × 12 because of compounding effects. Instead, use:
Annual Churn Rate (%) = (1 – (1 – Monthly Churn)^12) × 100
A 2% monthly churn rate compounds to 21.7% annual churn, not 24%.
Gross vs. Net Churn
Gross churn counts all disconnections. Net churn subtracts reconnections and additions within the same period. If you lost 300 subscribers but regained 50 who returned, net churn is 250 subscribers—a more accurate reflection of actual customer loss.
Progressive FTTH operators track both. Gross churn reveals experience or competitive issues (too many disconnections). Net churn shows overall trajectory. A company with 3% gross churn but 2% net churn is successfully recovering some at-risk customers, a sign their win-back programs work.
Cohort-Based Churn Analysis
Cohort analysis segments subscribers by acquisition date and tracks their survival rate over time. A cohort acquired in Q1 2023 might show:
- 98% retention after 3 months
- 94% retention after 6 months
- 88% retention after 12 months
- 85% retention after 18 months
This reveals whether churn front-loads (problems in first 6 months) or is gradual (stable after initial settling period). Cohort data is invaluable for pinpointing when and where customers at-risk most commonly disconnect.
Real-Time Churn Dashboards
Best-in-class FTTH operators track churn daily, not monthly. Dashboards should display:
- Daily churn count and trending (7-day rolling average)
- Churn by segment (speed tier, geography, customer tenure)
- Churn reasons (captured at cancellation: competitor, price, service quality, relocation)
- Cohort retention curves (how long this month’s cohorts survive)
BI tools like Tableau, Looker, or custom data warehouse solutions enable this granularity. The faster you identify churn spikes, the faster you can intervene.
Industry Benchmarks — What is “Good” Churn for FTTH Operators?
Churn benchmarks vary dramatically by market maturity, geography, and competitive intensity. No single target fits all contexts.
By Market Stage
New market deployment (first 12 months): 3–5% monthly churn is typical. Early adopters are often technically sophisticated and price-sensitive; they switch quickly if service disappoints. Expect high early churn while you optimize operations.
Growth phase (months 12–36): 2–3% monthly churn as you build subscriber base and service quality stabilizes. Churn typically declines as customer satisfaction metrics improve and competitive intensity normalizes.
Mature market (3+ years): 1.5–2.5% monthly churn in well-run operations. Mature markets have:
- Established service delivery processes
- Higher switching costs (bundling, habits)
- Stable competitive positioning
- Customers with longer tenure (more loyal)
Operators reporting sub-1% monthly churn are exceptional; it typically requires heavy bundling (FTTH + mobile + TV) or limited local competition.
Regional Variations
Southeast Asia (Vietnam, Philippines, Thailand): 2–4% monthly churn. Hypercompetitive markets with price-driven switching and lower ARPU limits retention investment ROI.
Europe (Germany, France, Spain): 1.5–2.5% monthly churn. More mature markets with bundled services and stronger customer experience norms.
North America: 1–2% monthly for Tier 1 operators; 2–3% for regional players. Higher ARPU enables more retention spending.
India & emerging markets: 3–6% monthly churn. Price sensitivity, lower tenure, and limited differentiation drive higher churn.
Tier 1 ISPs vs. Regional Operators
Tier 1 operators (Verizon Fios, Deutsche Telekom Glasfaser, Singtel): 1–1.5% monthly churn. Scale and brand strength reduce churn.
Regional/municipal FTTH operators: 2–3.5% monthly churn. Limited brand recognition, smaller customer service budgets, and concentrated competitive threats increase churn.
The gap reflects superior customer experience, bundling options, and financial capacity to invest in retention at Tier 1 operators. Regional operators must choose their churn reduction bets carefully.
According to the FTTH Council’s latest market analysis, operators in established fiber markets (Europe, North America) are seeing churn stabilize as market maturity increases. Those still in the deployment phase continue to experience higher churn volatility, emphasizing the importance of cohort-based measurement to distinguish early-adoption churn from operational issues.
Root Causes of Subscriber Churn in FTTH Networks

Churn is not random. Operators who analyze disconnection reasons consistently discover patterns—and patterns are actionable.
Service Quality & Network Issues
Speed inconsistency is a primary churn driver in FTTH markets. A subscriber buys 100 Mbps but regularly experiences 60 Mbps. They tolerate it for a few months, then compare to competitor offerings and leave. Intermittent outages—even brief 15-minute disruptions—erode trust. Unlike wireless networks where brief outages are expected, FTTH customers expect wire-line reliability (99.9%+).
Latency and jitter issues affect gaming and video conferencing users disproportionately. These segments are high-value (typically Tier 2–3 plans) and churn when quality degrades. Network congestion during peak hours is a hidden churn driver; many operators don’t instrument deep enough to detect it.
Action: Implement proactive network monitoring and real-time SLA visibility to customers. Publish uptime dashboards and speed-test tools that build trust.
Customer Experience Factors
Onboarding friction kills retention before it starts. Poor installation experiences, delayed technician appointments, or unresolved setup issues in the first 30 days drive churn. Cohort data consistently shows that subscribers with smooth onboarding stay 15–20% longer.
Customer support responsiveness is another silent killer. A customer with a problem waits 24 hours for a callback and gives up, switching to a competitor with faster response. FTTH subscribers expect omnichannel support: chat, phone, email, in-app messaging. Forcing customers to call a phone line in 2024 is a churn risk.
Billing complexity and billing errors drive involuntary churn and voluntary churn in equal measure. Confusing invoices, unexpected fees, or multiple billing cycles frustrate customers disproportionately. This issue is especially acute for bundle services (internet + TV + mobile) where different billing systems collide.
Action: Invest in onboarding quality (incentivize early engagement, proactive support). Implement 24/7 support and self-service troubleshooting portals. Simplify billing presentation.
Competitive & Pricing Pressures
Price is a leading churn driver when market alternatives exist. A customer paying $80/month for 100 Mbps receives a competitive offer at $60/month and leaves. FTTH markets with multiple operators see 30–50% higher churn than monopoly deployments.
Speed differentiation fails when competitors offer parity. If you sell 100 Mbps, 300 Mbps, and 1 Gbps tiers but all competitors offer the same, customers have no reason to stay beyond price. Without differentiation in service tiers, bundles, or features, FTTH becomes a commodity.
Contract length and flexibility matter. Month-to-month contracts reduce switching friction; 12–24 month contracts lock customers in but create resentment and higher involuntary churn (non-renewals). The optimal approach varies by market maturity.
Action: Bundle FTTH with mobile or TV services to increase switching costs. Introduce service tiers with clear value gaps (speed, support SLAs, features). Monitor competitive pricing daily and deploy dynamic win-back offers.
Operational Factors
High customer acquisition cost (CAC) without proportional retention investment creates perverse incentives. A operator spending $300 to acquire a customer but only $20 on retention will naturally lose profitable customers. Retention ROI is typically 5-10x higher than acquisition ROI.
Lack of proactive outreach allows churn to occur passively. Best-in-class operators run:
- 30-day check-in calls to new subscribers (net new churn reduction: 8–15%)
- Quarterly engagement campaigns highlighting unused services or upgrade opportunities
- Predictive churn models that flag at-risk customers for intervention before they cancel
Silent customers are at-risk customers. Operators who communicate regularly lose fewer subscribers.
Insufficient data on churn patterns delays response. Operators without cohort analysis, segmentation, or churn reason capture cannot identify systemic issues. They react month-to-month instead of building systematic solutions.
Action: Allocate retention budgets proportional to revenue. Build predictive churn models using tenure, usage, support tickets, and demographic data. Implement automated outreach workflows for at-risk segments.
Retention Strategies to Reduce FTTH Churn
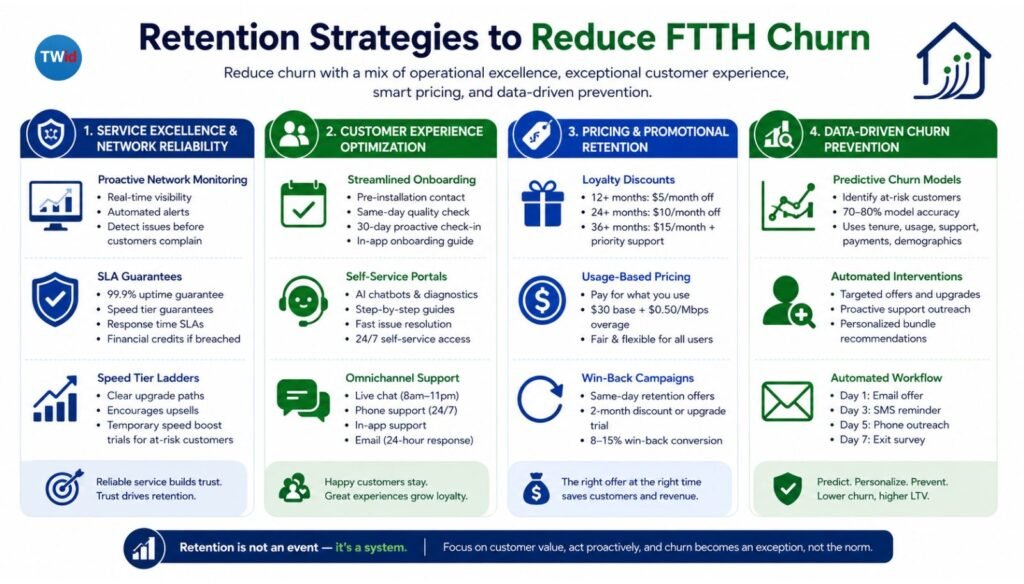
Reducing churn requires a mix of operational, product, and marketing initiatives. There is no single lever—churn reduction is systemic.
Service Excellence & Network Reliability
Proactive network monitoring begins with visibility. Deploy network telemetry that tracks quality metrics at the customer level:
- Actual speeds (not provisioned speeds) every hour
- Latency and jitter for latency-sensitive applications
- Packet loss and DNS resolution times
- Congestion on peak and off-peak hours
When a customer’s network quality degrades, automated systems alert them: “We’ve detected slower speeds on your line. A technician will visit on [date], or you can schedule [link].” This beats waiting for them to complain.
SLA guarantees with financial penalties build trust. Offer:
- 99.9% uptime guarantee with $10–$20 monthly credit if breached
- Speed tier guarantees (“Your 100 Mbps plan includes speeds of 90+ Mbps 95% of the time”)
- Response time SLAs for support tickets
Transparent SLAs signal confidence in your network. Operators without SLAs seem untrustworthy by comparison.
Speed tier ladders encourage upgrades over switching. Offer clear upgrade paths:
- 50 Mbps → 100 Mbps → 300 Mbps → 1 Gbps
- Each tier priced to allow occasional upsell ($55 → $75 → $95 → $150/month examples)
- Temporary speed boosts (free 2-week trial of higher tier for at-risk segments)
Customers who upgrade stay longer. Upgraders have higher switching costs (mental investment in faster tiers) and are higher-value targets for retention.
Customer Experience Optimization
Streamlined onboarding reduces early-tenure churn. Best practice workflow:
- Pre-installation contact (48 hours before): Confirm appointment, set expectations, gather info
- Same-day quality check: Technician runs speed test during install and confirms speeds hit tier minimums
- 30-day check-in: Proactive support call, troubleshoot if needed, confirm satisfaction
- In-app onboarding: Guide customers to Wi-Fi setup, bundled services, mobile app installation
Operators who implement this see 8–12% churn reduction in first-year cohorts.
Self-service troubleshooting portals reduce support wait times. Embed AI-powered chatbots that handle:
- “Why is my internet slow?” → diagnostics + automated speed tests + escalation if needed
- “How do I reset my router?” → video guides + step-by-step instructions
- “How do I upgrade my plan?” → quick upgrade workflow with no agent touch
Customers who resolve issues within 10 minutes via self-service rarely churn. Those who wait on hold churn at 3x the rate.
Omnichannel support availability is table stakes:
- Live chat (8am–11pm, under 5-minute wait)
- Phone support (24/7, under 10-minute wait)
- In-app support (ticket tracking, proactive outreach)
- Email (24-hour response)
One support channel creates churn. Omnichannel reduces churn by 15–25% versus phone-only.
Pricing & Promotional Retention
Loyalty discounts for long-tenure subscribers signal appreciation and increase switching costs. Example program:
- 12+ months: $5/month loyalty discount
- 24+ months: $10/month loyalty discount
- 36+ months: $15/month + priority support
Cost of discount is 3–4% of monthly revenue. Reduction in churn is typically 8–15%. ROI is positive.
Usage-based pricing appeals to value-conscious segments. Instead of fixed tiers, allow pay-for-what-you-use (e.g., $30 base + $0.50/Mbps overage). Customers who use less feel they’re getting a good deal; heavy users upgrade proactively.
Win-back campaigns target cancellation. When a customer schedules disconnection:
- Immediate retention offer (same day): 2-month discount or speed tier upgrade (free trial for 30 days)
- Follow-up if they disconnect anyway (30 days post-cancel): “We miss you” offer (75% off first month if you return)
Win-back conversion rates are 8–15%, far cheaper than acquiring a new subscriber.
Data-Driven Churn Prevention
Predictive churn models identify at-risk customers before they cancel. Build models using:
- Tenure (newer subscribers churn more)
- Usage patterns (declining usage indicates disengagement)
- Support ticket volume (multiple support issues = frustration)
- Payment behavior (late payments correlate with churn)
- Demographic/firmographic data (age, location, competitive density)
Machine learning models achieve 70–80% accuracy. When flagged, at-risk customers receive automated intervention:
- $10 discount offer
- Speed upgrade trial
- Proactive support check-in
- Personalized bundle recommendation
Automated intervention workflows save operators from reactive firefighting. When a customer triggers a churn risk flag:
- Day 1: Email offer (discount or upgrade trial)
- Day 3: SMS reminder (“Don’t miss this offer”)
- Day 5: Phone outreach (if high-value customer, >$150/month)
- Day 7: Exit survey if they still cancel (gather feedback)
Churn reduction from targeted interventions: 12–20% on flagged segments.
Connecting Churn to FTTH Growth Strategy
Churn reduction is not separate from growth—it is integral to growth strategy. Understanding this connection transforms how operators prioritize investment.
FTTH growth strategies rely on expanding subscriber base and extending customer lifetime. Both are undermined by high churn. A 3% monthly churn rate requires you to acquire 36% of your base annually just to stay flat. This creates a “churn treadmill” where marketing budgets chase replacement customers rather than expanding network footprint.
Reducing churn from 3% to 2% monthly is equivalent to a 33% growth acceleration. That same marketing budget now grows your customer base instead of replacing lost subscribers. Over 5 years, a 1% churn improvement drives 50–100% higher cumulative subscriber growth.
Retention-focused growth flips the math. Instead of “spend $300 to acquire, lose to 3% churn,” it becomes “spend $300 to acquire, spend $30/year to retain, lose to 1.5% churn.” The lifetime value math improves dramatically:
- 3% monthly churn: $2,500 average CLV, $25 annual retention cost = $2,475 profit per customer
- 1.5% monthly churn: $4,000 average CLV, $40 annual retention cost = $3,960 profit per customer
That $1,500 CLV difference pays for superior customer experience 50 times over.
Payback periods on fiber deployment compress dramatically with retention. A build requiring 2,500 customers at 3% churn reaches breakeven in year 6. The same build with 1.5% churn reaches breakeven in year 4. That 2-year acceleration allows earlier expansion to new areas, creating a virtuous cycle of network growth.
According to Broadband Communities Magazine’s 2024 Fiber Market Report, operators who systematized retention as a core business function achieved 15–25% faster payback periods on fiber investments compared to acquisition-focused peers. The report emphasizes that FTTH profitability is determined less by subscriber growth rate and more by churn management discipline
Tools & Frameworks for Managing FTTH Churn
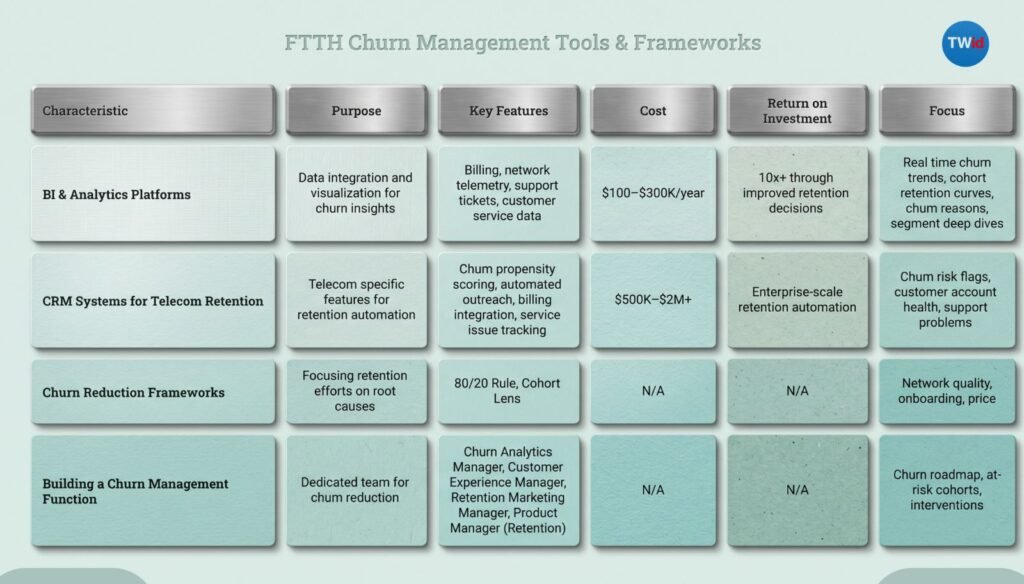
Systematic churn reduction requires tooling and organizational structure.
BI & Analytics Platforms
Modern FTTH operators deploy data warehouses that integrate:
- Billing systems (subscriber details, payment history, tier/plan changes)
- Network telemetry (speed, latency, outages, quality metrics)
- Support tickets (issue type, resolution time, satisfaction rating)
- Customer service data (calls, chats, email sentiment)
Platforms like Snowflake, BigQuery, or Redshift feed into visualization layers (Tableau, Looker, Metabase). Dashboards surface:
- Real-time churn trends (daily churn vs. target)
- Cohort retention curves (how cohorts perform over lifetime)
- Churn reasons (why customers left, tracked at cancellation)
- Segment deep dives (churn by geography, tier, tenure)
This infrastructure costs $100–$300K/year but returns 10x+ through improved retention decisions.
CRM Systems for Telecom Retention
Generic CRMs (Salesforce, HubSpot) lack telecom-specific features. Purpose-built systems (Amdocs, NetCracker, Comtech) include:
- Churn propensity scoring (built-in predictive models)
- Automated outreach workflows (triggered by churn risk flags)
- Billing integration (view customer account health + payment trends)
- Service issue tracking (link support problems to churn risk)
These systems cost $500K–$2M+ but enable enterprise-scale retention automation.
Churn Reduction Frameworks
The 80/20 Rule: 80% of churn comes from 20% of root causes. Operators should focus retention effort on the biggest drivers:
- If network quality causes 40% of churn, invest heavily in monitoring and SLAs
- If onboarding causes 25% of churn, redesign technician training and early engagement
- If price causes 20% of churn, develop competitive bundling strategies
Do not spread retention effort evenly; concentrate it on high-impact issues.
The Cohort Lens: Churn varies by customer cohort. New subscribers churn differently than 3-year veterans. High-speed users (1 Gbps) churn differently than light users (50 Mbps). Build distinct retention strategies per cohort:
- New cohorts: Focus on onboarding and early engagement
- Mature cohorts: Focus on upsell and loyalty programs
- Price-sensitive cohorts: Focus on bundling and value communication
- Premium cohorts: Focus on service SLAs and exclusive features
Building a Churn Management Function
Enterprise FTTH operators should establish a dedicated Subscriber Retention team reporting to the Chief Commercial Officer:
- Churn Analytics Manager: Owns dashboards, cohort analysis, churn reason taxonomy
- Customer Experience Manager: Owns onboarding, support, and engagement strategies
- Retention Marketing Manager: Owns win-back campaigns, loyalty programs, targeted offers
- Product Manager (Retention): Owns service tiers, bundling, and churn-reduction features
This team meets weekly to review churn trends, discuss at-risk cohorts, and prioritize interventions. They own the churn roadmap—not IT, not Marketing, not Operations—and are incentivized on churn reduction metrics.
Conclusion: Turn Churn Into Your Competitive Advantage
Churn is a financial lever that separates successful FTTH operators from those facing margin pressure and growth ceilings. The simplest way to grow is not to lose. An operator controlling churn at 1.5% monthly wins against competitors at 2.5% monthly, even with identical acquisition spending.
Churn reduction is neither a tactical program nor a support function—it is a strategic priority that touches every part of your organization. Network operations, customer service, product, billing, and marketing must align on a shared churn reduction goal.
The good news: churn is controllable. Unlike market growth (which you cannot control), churn responds to operational excellence, product design, and customer experience. Start by understanding your current churn baseline, identify the top 2–3 drivers, and build targeted interventions. Measure progress weekly. Celebrate wins. Iterate.
Get Your FTTH Churn Reduction Checklist
Ready to reduce churn in your fiber network? Download our FTTH Churn Reduction Checklist—a 20-item framework covering:
- Churn measurement and baseline setting
- Root cause analysis playbook
- Quick wins for churn reduction (implementable in 30 days)
- Long-term retention strategy roadmap
[Get the Checklist] or [Contact us to discuss FTTH retention strategies tailored to your market].