TWid
TheWriter.id

What Does Churned Mean in the Home Internet Broadband FTTH Industry? Managing Retention to Reduce Subscriber Loss

What does churn mean in FTTH: subscriber retention strategies reducing broadband churn rates

What does churned mean in the fiber-to-the-home (FTTH) broadband market?

One metric determines profitability more than any other: churn.

A single percentage point difference in monthly churn can cost an FTTH operator millions in lost lifetime value across thousands of subscribers. Yet many operators still treat churn as a byproduct of market competition rather than a strategic lever they can control.

This post defines what “churned” means in FTTH, explains why it matters to your bottom line, and shows how data-driven retention strategies can transform your growth trajectory. By the end, you’ll understand not just the mechanics of churn, but how to build a retention machine that protects your subscriber base and maximizes the ROI of your fiber network investment.

Understanding Churn — The Definition Every FTTH Operator Needs

Churn in telecommunications refers to the percentage of subscribers who cancel their service during a specific period—usually measured monthly or annually. A subscriber is marked as “churned” the moment they formally disconnect their service or fail to pay for a billing cycle (in involuntary churn scenarios).

In the FTTH industry, churn is expressed as a rate: the number of subscribers lost divided by the average number of active subscribers during that period.

Voluntary vs. Involuntary Churn

Not all churn is created equal. Voluntary churn occurs when subscribers actively choose to cancel service—they switch to a competitor, move out of the service area, or simply discontinue the service. Involuntary churn happens when subscribers lose service due to non-payment or technical issues beyond their control. FTTH operators typically track both separately because the retention strategies differ significantly.

Voluntary churn indicates competitive or service quality issues you can address. Involuntary churn points to billing systems, collections processes, or network reliability problems that require operational fixes.

Why FTTH Churn Differs from Mobile or Legacy Broadband

FTTH churn operates in a different ecosystem than mobile networks. Mobile subscribers often tolerate service disruptions because switching involves porting numbers and changing habits. FTTH subscribers face lower switching friction—they can activate competitor service within days if broadband alternatives exist. This makes FTTH markets more price-sensitive and experience-sensitive than wireless.

Legacy copper-based broadband (DSL, HSD) often carried higher natural switching costs (longer contracts, bundling lock-in). FTTH markets are typically more competitive because fiber is deployed in higher-density areas where multiple operators may exist, creating direct price and speed comparisons. Understanding this context is critical to setting realistic churn targets.

Why Churn Rate is the Most Critical KPI for FTTH ISPs

Churn is not just a customer retention metric—it is a financial lever that directly impacts every element of FTTH operator economics.

Customer lifetime value (CLV) is where churn’s impact becomes apparent. If your average subscriber pays $60/month and stays for 48 months, CLV is roughly $2,880 (before costs). If churn increases from 2% monthly (staying ~50 months) to 3% monthly (staying ~33 months), your CLV drops by 34%. That single percentage point difference transforms a profitable customer into a marginal one.

Churn also erodes ARPU (Average Revenue Per User) growth. New fiber subscribers typically upgrade to higher-tier plans over time—more bandwidth, bundled services, premium support. Churn intercepts this trajectory. A customer you lose in month 6 never reaches the tier 3 product you’d have sold them in month 18. This is why fiber ARPU growth strategies only work when paired with robust retention. You cannot grow revenue per user if customers leave before they upgrade.

From a network perspective, churn determines your payback period on fiber deployment. A fiber build costs $1,500–$2,500 per passable home in typical deployments. If churn forces you to replace 15% of your subscriber base annually, you’re perpetually reinvesting in acquisition rather than expanding to new areas. Operators with 2% monthly churn reach profitability 2–3 years faster than those at 3% monthly churn.

Competitive positioning is also affected. In saturated FTTH markets, churn becomes the differentiator. Two operators with identical speeds and pricing are separated only by service quality and retention performance. The one with 1.5% monthly churn wins market share; the one at 3% loses ground despite similar acquisition efforts.

How to Calculate and Measure FTTH Churn Rate

FTTH churn rate infographic showing how to calculate monthly and annual broadband subscriber churn, compare gross vs net churn, analyze customer retention cohorts, and monitor real-time churn dashboards to reduce fiber customer loss.

Churn appears simple on the surface—dividing subscribers lost by average subscribers—but measurement rigor matters for benchmarking and strategic decisions.

Standard Churn Calculation

The most common formula is:

Monthly Churn Rate (%) = (Subscribers Lost During Month / Average Active Subscribers During Month) × 100

Example: If you start the month with 10,000 subscribers, end with 9,700 (lost 300), your average is 9,850. Monthly churn = (300 / 9,850) × 100 = 3.05%.

Annualized churn is NOT simply monthly × 12 because of compounding effects. Instead, use:

Annual Churn Rate (%) = (1 – (1 – Monthly Churn)^12) × 100

A 2% monthly churn rate compounds to 21.7% annual churn, not 24%.

Gross vs. Net Churn

Gross churn counts all disconnections. Net churn subtracts reconnections and additions within the same period. If you lost 300 subscribers but regained 50 who returned, net churn is 250 subscribers—a more accurate reflection of actual customer loss.

Progressive FTTH operators track both. Gross churn reveals experience or competitive issues (too many disconnections). Net churn shows overall trajectory. A company with 3% gross churn but 2% net churn is successfully recovering some at-risk customers, a sign their win-back programs work.

Cohort-Based Churn Analysis

Cohort analysis segments subscribers by acquisition date and tracks their survival rate over time. A cohort acquired in Q1 2023 might show:

  • 98% retention after 3 months
  • 94% retention after 6 months
  • 88% retention after 12 months
  • 85% retention after 18 months

This reveals whether churn front-loads (problems in first 6 months) or is gradual (stable after initial settling period). Cohort data is invaluable for pinpointing when and where customers at-risk most commonly disconnect.

Real-Time Churn Dashboards

Best-in-class FTTH operators track churn daily, not monthly. Dashboards should display:

  • Daily churn count and trending (7-day rolling average)
  • Churn by segment (speed tier, geography, customer tenure)
  • Churn reasons (captured at cancellation: competitor, price, service quality, relocation)
  • Cohort retention curves (how long this month’s cohorts survive)

BI tools like Tableau, Looker, or custom data warehouse solutions enable this granularity. The faster you identify churn spikes, the faster you can intervene.

Industry Benchmarks — What is “Good” Churn for FTTH Operators?

Churn benchmarks vary dramatically by market maturity, geography, and competitive intensity. No single target fits all contexts.

By Market Stage

New market deployment (first 12 months): 3–5% monthly churn is typical. Early adopters are often technically sophisticated and price-sensitive; they switch quickly if service disappoints. Expect high early churn while you optimize operations.

Growth phase (months 12–36): 2–3% monthly churn as you build subscriber base and service quality stabilizes. Churn typically declines as customer satisfaction metrics improve and competitive intensity normalizes.

Mature market (3+ years): 1.5–2.5% monthly churn in well-run operations. Mature markets have:

  • Established service delivery processes
  • Higher switching costs (bundling, habits)
  • Stable competitive positioning
  • Customers with longer tenure (more loyal)

Operators reporting sub-1% monthly churn are exceptional; it typically requires heavy bundling (FTTH + mobile + TV) or limited local competition.

Regional Variations

Southeast Asia (Vietnam, Philippines, Thailand): 2–4% monthly churn. Hypercompetitive markets with price-driven switching and lower ARPU limits retention investment ROI.

Europe (Germany, France, Spain): 1.5–2.5% monthly churn. More mature markets with bundled services and stronger customer experience norms.

North America: 1–2% monthly for Tier 1 operators; 2–3% for regional players. Higher ARPU enables more retention spending.

India & emerging markets: 3–6% monthly churn. Price sensitivity, lower tenure, and limited differentiation drive higher churn.

Tier 1 ISPs vs. Regional Operators

Tier 1 operators (Verizon Fios, Deutsche Telekom Glasfaser, Singtel): 1–1.5% monthly churn. Scale and brand strength reduce churn.

Regional/municipal FTTH operators: 2–3.5% monthly churn. Limited brand recognition, smaller customer service budgets, and concentrated competitive threats increase churn.

The gap reflects superior customer experience, bundling options, and financial capacity to invest in retention at Tier 1 operators. Regional operators must choose their churn reduction bets carefully.

According to the FTTH Council’s latest market analysis, operators in established fiber markets (Europe, North America) are seeing churn stabilize as market maturity increases. Those still in the deployment phase continue to experience higher churn volatility, emphasizing the importance of cohort-based measurement to distinguish early-adoption churn from operational issues.

Root Causes of Subscriber Churn in FTTH Networks

FTTH subscriber churn infographic showing the root causes of customer loss in fiber broadband networks, including service quality issues, poor customer experience, competitive pricing pressures, and operational challenges.

Churn is not random. Operators who analyze disconnection reasons consistently discover patterns—and patterns are actionable.

Service Quality & Network Issues

Speed inconsistency is a primary churn driver in FTTH markets. A subscriber buys 100 Mbps but regularly experiences 60 Mbps. They tolerate it for a few months, then compare to competitor offerings and leave. Intermittent outages—even brief 15-minute disruptions—erode trust. Unlike wireless networks where brief outages are expected, FTTH customers expect wire-line reliability (99.9%+).

Latency and jitter issues affect gaming and video conferencing users disproportionately. These segments are high-value (typically Tier 2–3 plans) and churn when quality degrades. Network congestion during peak hours is a hidden churn driver; many operators don’t instrument deep enough to detect it.

Action: Implement proactive network monitoring and real-time SLA visibility to customers. Publish uptime dashboards and speed-test tools that build trust.

Customer Experience Factors

Onboarding friction kills retention before it starts. Poor installation experiences, delayed technician appointments, or unresolved setup issues in the first 30 days drive churn. Cohort data consistently shows that subscribers with smooth onboarding stay 15–20% longer.

Customer support responsiveness is another silent killer. A customer with a problem waits 24 hours for a callback and gives up, switching to a competitor with faster response. FTTH subscribers expect omnichannel support: chat, phone, email, in-app messaging. Forcing customers to call a phone line in 2024 is a churn risk.

Billing complexity and billing errors drive involuntary churn and voluntary churn in equal measure. Confusing invoices, unexpected fees, or multiple billing cycles frustrate customers disproportionately. This issue is especially acute for bundle services (internet + TV + mobile) where different billing systems collide.

Action: Invest in onboarding quality (incentivize early engagement, proactive support). Implement 24/7 support and self-service troubleshooting portals. Simplify billing presentation.

Competitive & Pricing Pressures

Price is a leading churn driver when market alternatives exist. A customer paying $80/month for 100 Mbps receives a competitive offer at $60/month and leaves. FTTH markets with multiple operators see 30–50% higher churn than monopoly deployments.

Speed differentiation fails when competitors offer parity. If you sell 100 Mbps, 300 Mbps, and 1 Gbps tiers but all competitors offer the same, customers have no reason to stay beyond price. Without differentiation in service tiers, bundles, or features, FTTH becomes a commodity.

Contract length and flexibility matter. Month-to-month contracts reduce switching friction; 12–24 month contracts lock customers in but create resentment and higher involuntary churn (non-renewals). The optimal approach varies by market maturity.

Action: Bundle FTTH with mobile or TV services to increase switching costs. Introduce service tiers with clear value gaps (speed, support SLAs, features). Monitor competitive pricing daily and deploy dynamic win-back offers.

Operational Factors

High customer acquisition cost (CAC) without proportional retention investment creates perverse incentives. A operator spending $300 to acquire a customer but only $20 on retention will naturally lose profitable customers. Retention ROI is typically 5-10x higher than acquisition ROI.

Lack of proactive outreach allows churn to occur passively. Best-in-class operators run:

  • 30-day check-in calls to new subscribers (net new churn reduction: 8–15%)
  • Quarterly engagement campaigns highlighting unused services or upgrade opportunities
  • Predictive churn models that flag at-risk customers for intervention before they cancel

Silent customers are at-risk customers. Operators who communicate regularly lose fewer subscribers.

Insufficient data on churn patterns delays response. Operators without cohort analysis, segmentation, or churn reason capture cannot identify systemic issues. They react month-to-month instead of building systematic solutions.

Action: Allocate retention budgets proportional to revenue. Build predictive churn models using tenure, usage, support tickets, and demographic data. Implement automated outreach workflows for at-risk segments.

Retention Strategies to Reduce FTTH Churn
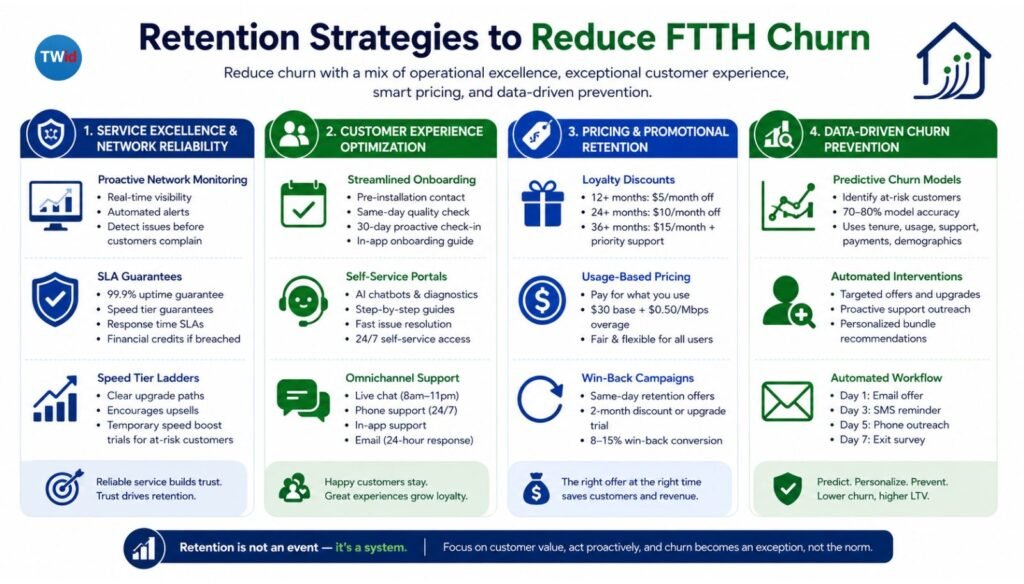
FTTH churn reduction infographic showing retention strategies including proactive network monitoring, customer experience optimization, loyalty programs, win-back campaigns, and predictive churn prevention.

Reducing churn requires a mix of operational, product, and marketing initiatives. There is no single lever—churn reduction is systemic.

Service Excellence & Network Reliability

Proactive network monitoring begins with visibility. Deploy network telemetry that tracks quality metrics at the customer level:

  • Actual speeds (not provisioned speeds) every hour
  • Latency and jitter for latency-sensitive applications
  • Packet loss and DNS resolution times
  • Congestion on peak and off-peak hours

When a customer’s network quality degrades, automated systems alert them: “We’ve detected slower speeds on your line. A technician will visit on [date], or you can schedule [link].” This beats waiting for them to complain.

SLA guarantees with financial penalties build trust. Offer:

  • 99.9% uptime guarantee with $10–$20 monthly credit if breached
  • Speed tier guarantees (“Your 100 Mbps plan includes speeds of 90+ Mbps 95% of the time”)
  • Response time SLAs for support tickets

Transparent SLAs signal confidence in your network. Operators without SLAs seem untrustworthy by comparison.

Speed tier ladders encourage upgrades over switching. Offer clear upgrade paths:

  • 50 Mbps → 100 Mbps → 300 Mbps → 1 Gbps
  • Each tier priced to allow occasional upsell ($55 → $75 → $95 → $150/month examples)
  • Temporary speed boosts (free 2-week trial of higher tier for at-risk segments)

Customers who upgrade stay longer. Upgraders have higher switching costs (mental investment in faster tiers) and are higher-value targets for retention.

Customer Experience Optimization

Streamlined onboarding reduces early-tenure churn. Best practice workflow:

  1. Pre-installation contact (48 hours before): Confirm appointment, set expectations, gather info
  2. Same-day quality check: Technician runs speed test during install and confirms speeds hit tier minimums
  3. 30-day check-in: Proactive support call, troubleshoot if needed, confirm satisfaction
  4. In-app onboarding: Guide customers to Wi-Fi setup, bundled services, mobile app installation

Operators who implement this see 8–12% churn reduction in first-year cohorts.

Self-service troubleshooting portals reduce support wait times. Embed AI-powered chatbots that handle:

  • “Why is my internet slow?” → diagnostics + automated speed tests + escalation if needed
  • “How do I reset my router?” → video guides + step-by-step instructions
  • “How do I upgrade my plan?” → quick upgrade workflow with no agent touch

Customers who resolve issues within 10 minutes via self-service rarely churn. Those who wait on hold churn at 3x the rate.

Omnichannel support availability is table stakes:

  • Live chat (8am–11pm, under 5-minute wait)
  • Phone support (24/7, under 10-minute wait)
  • In-app support (ticket tracking, proactive outreach)
  • Email (24-hour response)

One support channel creates churn. Omnichannel reduces churn by 15–25% versus phone-only.

Pricing & Promotional Retention

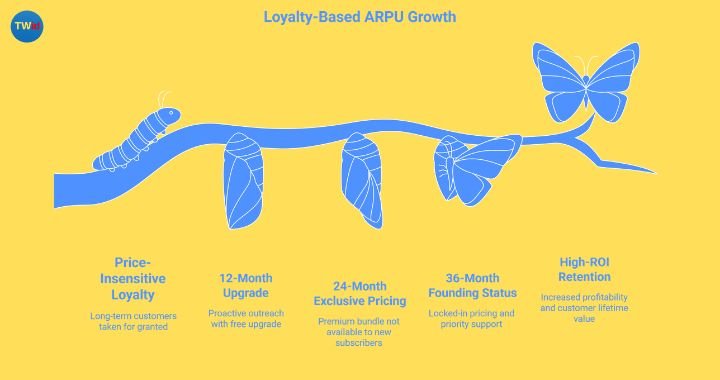
Loyalty discounts for long-tenure subscribers signal appreciation and increase switching costs. Example program:

  • 12+ months: $5/month loyalty discount
  • 24+ months: $10/month loyalty discount
  • 36+ months: $15/month + priority support

Cost of discount is 3–4% of monthly revenue. Reduction in churn is typically 8–15%. ROI is positive.

Usage-based pricing appeals to value-conscious segments. Instead of fixed tiers, allow pay-for-what-you-use (e.g., $30 base + $0.50/Mbps overage). Customers who use less feel they’re getting a good deal; heavy users upgrade proactively.

Win-back campaigns target cancellation. When a customer schedules disconnection:

  1. Immediate retention offer (same day): 2-month discount or speed tier upgrade (free trial for 30 days)
  2. Follow-up if they disconnect anyway (30 days post-cancel): “We miss you” offer (75% off first month if you return)

Win-back conversion rates are 8–15%, far cheaper than acquiring a new subscriber.

Data-Driven Churn Prevention

Predictive churn models identify at-risk customers before they cancel. Build models using:

  • Tenure (newer subscribers churn more)
  • Usage patterns (declining usage indicates disengagement)
  • Support ticket volume (multiple support issues = frustration)
  • Payment behavior (late payments correlate with churn)
  • Demographic/firmographic data (age, location, competitive density)

Machine learning models achieve 70–80% accuracy. When flagged, at-risk customers receive automated intervention:

  • $10 discount offer
  • Speed upgrade trial
  • Proactive support check-in
  • Personalized bundle recommendation

Automated intervention workflows save operators from reactive firefighting. When a customer triggers a churn risk flag:

  • Day 1: Email offer (discount or upgrade trial)
  • Day 3: SMS reminder (“Don’t miss this offer”)
  • Day 5: Phone outreach (if high-value customer, >$150/month)
  • Day 7: Exit survey if they still cancel (gather feedback)

Churn reduction from targeted interventions: 12–20% on flagged segments.

Connecting Churn to FTTH Growth Strategy

Churn reduction is not separate from growth—it is integral to growth strategy. Understanding this connection transforms how operators prioritize investment.

FTTH growth strategies rely on expanding subscriber base and extending customer lifetime. Both are undermined by high churn. A 3% monthly churn rate requires you to acquire 36% of your base annually just to stay flat. This creates a “churn treadmill” where marketing budgets chase replacement customers rather than expanding network footprint.

Reducing churn from 3% to 2% monthly is equivalent to a 33% growth acceleration. That same marketing budget now grows your customer base instead of replacing lost subscribers. Over 5 years, a 1% churn improvement drives 50–100% higher cumulative subscriber growth.

Retention-focused growth flips the math. Instead of “spend $300 to acquire, lose to 3% churn,” it becomes “spend $300 to acquire, spend $30/year to retain, lose to 1.5% churn.” The lifetime value math improves dramatically:

  • 3% monthly churn: $2,500 average CLV, $25 annual retention cost = $2,475 profit per customer
  • 1.5% monthly churn: $4,000 average CLV, $40 annual retention cost = $3,960 profit per customer

That $1,500 CLV difference pays for superior customer experience 50 times over.

Payback periods on fiber deployment compress dramatically with retention. A build requiring 2,500 customers at 3% churn reaches breakeven in year 6. The same build with 1.5% churn reaches breakeven in year 4. That 2-year acceleration allows earlier expansion to new areas, creating a virtuous cycle of network growth.

According to Broadband Communities Magazine’s 2024 Fiber Market Report, operators who systematized retention as a core business function achieved 15–25% faster payback periods on fiber investments compared to acquisition-focused peers. The report emphasizes that FTTH profitability is determined less by subscriber growth rate and more by churn management discipline

Tools & Frameworks for Managing FTTH Churn
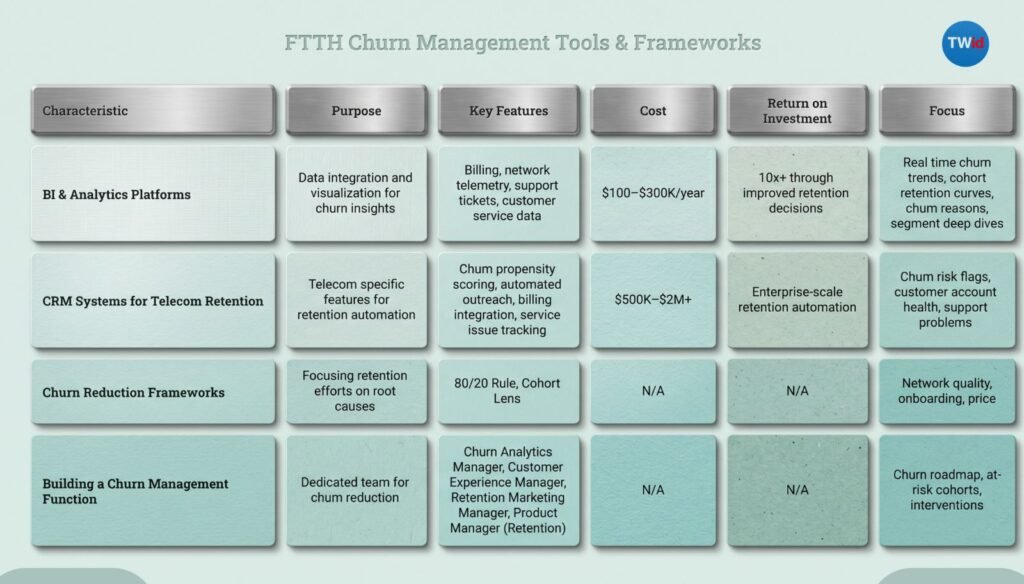
FTTH churn management infographic showing analytics tools, telecom CRM systems, cohort retention frameworks, churn propensity scoring, and subscriber retention team structure for reducing fiber broadband customer churn

Systematic churn reduction requires tooling and organizational structure.

BI & Analytics Platforms

Modern FTTH operators deploy data warehouses that integrate:

  • Billing systems (subscriber details, payment history, tier/plan changes)
  • Network telemetry (speed, latency, outages, quality metrics)
  • Support tickets (issue type, resolution time, satisfaction rating)
  • Customer service data (calls, chats, email sentiment)

Platforms like Snowflake, BigQuery, or Redshift feed into visualization layers (Tableau, Looker, Metabase). Dashboards surface:

  • Real-time churn trends (daily churn vs. target)
  • Cohort retention curves (how cohorts perform over lifetime)
  • Churn reasons (why customers left, tracked at cancellation)
  • Segment deep dives (churn by geography, tier, tenure)

This infrastructure costs $100–$300K/year but returns 10x+ through improved retention decisions.

CRM Systems for Telecom Retention

Generic CRMs (Salesforce, HubSpot) lack telecom-specific features. Purpose-built systems (Amdocs, NetCracker, Comtech) include:

  • Churn propensity scoring (built-in predictive models)
  • Automated outreach workflows (triggered by churn risk flags)
  • Billing integration (view customer account health + payment trends)
  • Service issue tracking (link support problems to churn risk)

These systems cost $500K–$2M+ but enable enterprise-scale retention automation.

Churn Reduction Frameworks

The 80/20 Rule: 80% of churn comes from 20% of root causes. Operators should focus retention effort on the biggest drivers:

  • If network quality causes 40% of churn, invest heavily in monitoring and SLAs
  • If onboarding causes 25% of churn, redesign technician training and early engagement
  • If price causes 20% of churn, develop competitive bundling strategies

Do not spread retention effort evenly; concentrate it on high-impact issues.

The Cohort Lens: Churn varies by customer cohort. New subscribers churn differently than 3-year veterans. High-speed users (1 Gbps) churn differently than light users (50 Mbps). Build distinct retention strategies per cohort:

  • New cohorts: Focus on onboarding and early engagement
  • Mature cohorts: Focus on upsell and loyalty programs
  • Price-sensitive cohorts: Focus on bundling and value communication
  • Premium cohorts: Focus on service SLAs and exclusive features

Building a Churn Management Function

Enterprise FTTH operators should establish a dedicated Subscriber Retention team reporting to the Chief Commercial Officer:

  • Churn Analytics Manager: Owns dashboards, cohort analysis, churn reason taxonomy
  • Customer Experience Manager: Owns onboarding, support, and engagement strategies
  • Retention Marketing Manager: Owns win-back campaigns, loyalty programs, targeted offers
  • Product Manager (Retention): Owns service tiers, bundling, and churn-reduction features

This team meets weekly to review churn trends, discuss at-risk cohorts, and prioritize interventions. They own the churn roadmap—not IT, not Marketing, not Operations—and are incentivized on churn reduction metrics.

Conclusion: Turn Churn Into Your Competitive Advantage

Churn is a financial lever that separates successful FTTH operators from those facing margin pressure and growth ceilings. The simplest way to grow is not to lose. An operator controlling churn at 1.5% monthly wins against competitors at 2.5% monthly, even with identical acquisition spending.

Churn reduction is neither a tactical program nor a support function—it is a strategic priority that touches every part of your organization. Network operations, customer service, product, billing, and marketing must align on a shared churn reduction goal.

The good news: churn is controllable. Unlike market growth (which you cannot control), churn responds to operational excellence, product design, and customer experience. Start by understanding your current churn baseline, identify the top 2–3 drivers, and build targeted interventions. Measure progress weekly. Celebrate wins. Iterate.


Get Your FTTH Churn Reduction Checklist

Ready to reduce churn in your fiber network? Download our FTTH Churn Reduction Checklist—a 20-item framework covering:

  • Churn measurement and baseline setting
  • Root cause analysis playbook
  • Quick wins for churn reduction (implementable in 30 days)
  • Long-term retention strategy roadmap

[Get the Checklist] or [Contact us to discuss FTTH retention strategies tailored to your market].

How FTTH Executives Should Structure Partnerships With ISPs on Open Access Networks

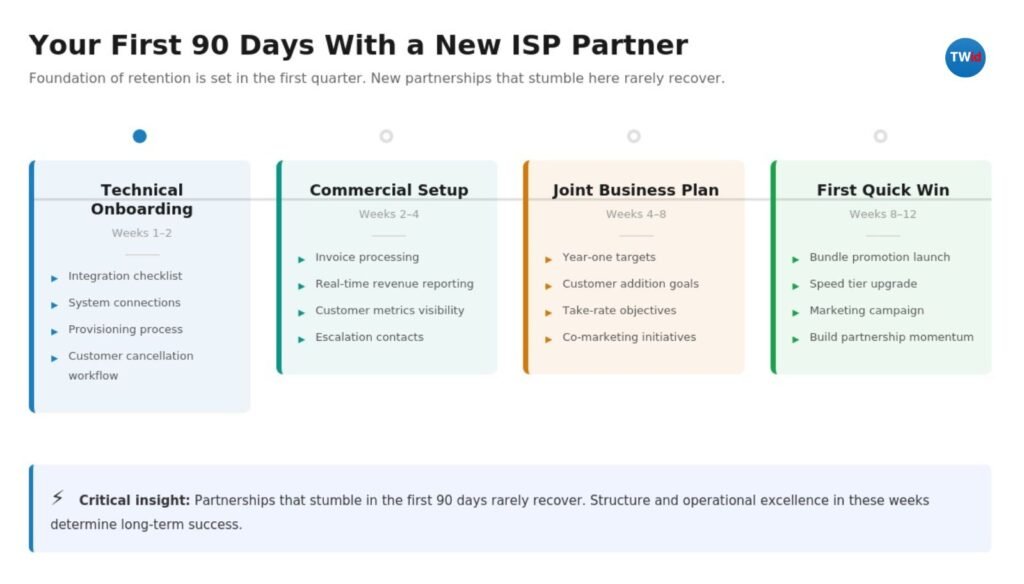
Four-phase ISP partnership onboarding timeline for FTTH operators: technical, commercial, business planning, and launch phases over 90 days

The call comes three years into a partnership: the ISP is leaving. You’ve built a world-class network, you’ve invested millions in fiber infrastructure, and you’ve connected thousands of premises. Yet your partner has decided to walk. By the time you’re negotiating the exit, it’s already too late.

This scenario plays out across the open-access fiber industry more often than operators want to admit. The root cause isn’t network quality or coverage—it’s partnership structure. FTTH operators often treat ISP partnerships as transactional relationships, focusing on acquisition over retention. But in open-access networks, your partners ARE your business. Lose them, and your wholesale revenue evaporates.

How should FTTH executives structure partnerships with ISPs on open-access networks to avoid this fate? The answer lies in embedding retention into every layer: contracts, revenue models, and operational support systems. This post outlines a framework for building partnerships that survive market cycles and grow together.

The Partnership Retention Crisis in Open-Access Networks

Open-access FTTH networks are built on a simple premise: the infrastructure operator leases capacity to multiple ISPs, who compete for end customers on the same fiber. This model works—in theory. In practice, partnerships fracture within 24 to 36 months for three predictable reasons.

First, ISPs struggle with margin. Wholesale rates that seemed reasonable at contract signing become unsustainable as customer acquisition costs rise and churn accelerates. ISPs find themselves with no clear path to profitability and no leverage to renegotiate. They either leave or operate at a loss.

Second, operational handoffs fail. An FTTH operator’s commercial team closes a deal with an ISP, then disappears. The ISP’s technical team has no single point of contact. Provisioning takes weeks. Support tickets go unanswered. Within a year, the partnership relationship erodes into a transactional mess.

Third, incentives misalign. The FTTH operator wants to maximize take-rate (total wholesale revenue per premise). The ISP wants to maximize customer lifetime value. When these goals conflict—or when the ISP sees no path to hitting their numbers—they exit.

The irony: retention, not acquisition, is the real lever for profitability. A partner who stays for seven years generates 3-4x the revenue of one who stays for two. Yet most FTTH operators optimize for deal closure, not partner success.

The fix requires restructuring partnerships at three levels: the contract, the revenue model, and the operational infrastructure. Each layer must reinforce the others.

Agreement Architecture: Building Retention Into the Contract

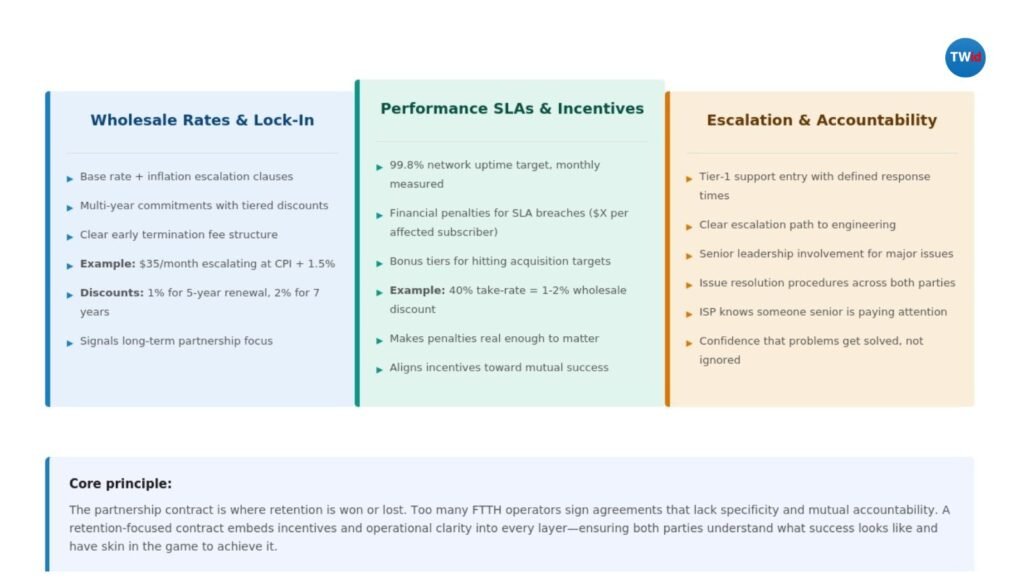
Three pillars of retention-focused ISP partnership contract architecture: wholesale rates with escalation clauses, performance SLAs with penalty and bonus structures, and escalation procedures with defined support tiers

The partnership contract is where retention is won or lost. Most FTTH operators sign ISP agreements that lack the specificity and mutual accountability required for long-term success. They’re typically thin on commercial terms and silent on operational expectations.

A retention-focused agreement has three components.

Clarity on Wholesale Rates and Long-Term Lock-In

Start with the wholesale rate structure. Too many FTTH operators lock ISPs into fixed rates for 3-5 years without escalation clauses tied to cost inflation. This creates a time bomb: as network operations costs rise, the ISP’s margin gets squeezed, and they start shopping for alternatives.

Instead, structure wholesale rates around transparent cost indices. For example: “Base rate of $35 per subscriber per month, escalating annually at [CPI + 1.5%].” This signals that you’re not treating the partnership as zero-sum. The ISP can model their long-term margins with confidence.

Pair rate clarity with multi-year commitments that reward longevity. Offer tiered discounts: 1% discount for a 5-year renewal, 2% for 7 years. This creates a financial incentive for the ISP to stay, and it locks in predictable revenue for you.

Exit costs matter too. Don’t make exit free—but make it transparent. A clear early termination fee (e.g., 6 months of remaining wholesale revenue) signals that you expect long-term relationships. It also gives the ISP’s board a reason to fix problems internally before walking.

Performance SLAs and Penalty/Reward Structures

Network uptime is table stakes. But equally important is the ISP’s confidence that when things break, someone will respond.

Define SLAs with teeth. For example: “99.8% network availability, measured monthly. For each 0.1% below target, FTTH operator credits ISP $X per affected subscriber per month.” Make the penalties real—large enough that operations teams prioritize fixes, not so large that they bankrupt you.

Equally critical: escalation procedures. If an ISP experiences a service issue, there should be a clear path to resolution—starting with tier-1 support, escalating to engineering if needed, with defined response times at each level. The ISP should know that someone senior is paying attention.

Include bonus tiers for partners who hit customer acquisition targets together. If an ISP reaches 40% take-rate on a network, reward them with a 1-2% wholesale discount. This aligns incentives and signals that you want them to succeed.

Revenue Models That Create Mutual Growth

The revenue model determines whether partnership retention is even possible. If your model doesn’t allow the ISP to build a sustainable business, no amount of goodwill fixes the relationship.

Most FTTH operators use one of two models: per-subscriber or capacity-based. Each has retention implications.

Per-subscriber models are simple to administer but create perverse incentives. As an FTTH operator, you want to maximize the number of active subscribers. The ISP wants to maximize customer lifetime value (which means higher churn tolerance if margins are fat). These goals diverge over time. Once an ISP realizes they’re paying you for every customer they acquire, regardless of lifetime value, they’ll hunt for alternatives or push back on rates.

Capacity-based models flip the incentive. You’re paid based on total provisioned capacity (e.g., $5 per Mbps per month), not actual customer count. The ISP can now optimize for profitability without worrying that every new customer costs them money. But this model requires clear definitions of capacity commitment and true-up mechanisms (annual adjustments based on actual usage).

Consider a hybrid: a blended rate that includes both per-subscriber revenue (base wholesale fee) and shared upside. For example: “$25 per subscriber monthly + 15% of retail ISP revenue above $45 per subscriber monthly.” This ties your upside to the ISP’s success. When they grow revenue per customer (through higher speeds, value-adds, or reduced churn), you both win.

To go deeper on structuring wholesale rates for profitability, read our guide on FTTH operators increasing take-rate. The key insight: take-rate isn’t just a pricing lever—it’s a partnership health metric. If your take-rate is dropping, your partners are struggling.

Building Operational Muscle to Keep Partners Sticky

Contracts and revenue models set the frame. Operational excellence keeps partners committed.

Partner Support Infrastructure

Most FTTH operators have a commercial team that closes deals, then hands off to a generic “operations” group. The ISP is now just another customer, competing for support bandwidth with hundreds of other issues.

Retention-focused operators build a dedicated partner success function. This is a small team (2-3 people per 5-10 ISP partners) whose only job is ensuring ISPs succeed. They should have deep technical knowledge, but also business acumen—they need to understand the ISP’s margin pressures, customer acquisition costs, and competitive threats.

The partnership success team owns three things:

Onboarding. The first 90 days determine the partnership’s trajectory. Have a documented onboarding playbook that covers technical integration (how the ISP’s systems connect to your network), commercial setup (billing, reporting, escalation contacts), and a joint business plan (targets for the year, how you’ll measure success together). Assign a single point of contact who stays with the partner for at least the first year.

Technical escalation. When a customer reports a service issue, the ISP needs to know that your NOC will respond. Define clear escalation paths: tier-1 support handles basic troubleshooting, tier-2 handles network diagnostics, tier-3 involves your engineering team. Response time should be faster for issues affecting multiple customers (indicating a network fault vs. a single customer issue).

Proactive outreach. Don’t wait for problems to surface. Partner success teams should monitor partner performance—customer growth, churn, support ticket volume—and flag trends before they become crises. If an ISP’s customer churn suddenly doubles, you should notice and ask what’s wrong before they do.

Joint Business Planning and Communication Cadence

Open-access partnerships are complex. They need more than annual contract reviews.

Establish a quarterly business review (QBR) cadence. Agenda items:

  • ISP performance: customer additions, churn, average revenue per user, wholesale revenue
  • Network performance: uptime, mean time to repair, ticket resolution times
  • Joint initiatives: upcoming network expansions, new service offerings, marketing campaigns
  • Troubleshooting: what’s working, what isn’t, and what needs to change

Use these reviews to surface issues early. If an ISP’s customer acquisition has stalled, you can diagnose together: Is it a network issue? A sales execution problem? A pricing misalignment? Solving it together strengthens the partnership; ignoring it accelerates churn.

Transparency about your network roadmap is equally critical. If you’re planning an expansion that will double available capacity in 12 months, the ISP needs to know. This helps them plan their own growth and reinforces that you’re betting on long-term success together.

Conduct a win-loss analysis on customer acquisitions. When an ISP loses a customer to a competitor, understand why. Is it price? Service quality? Product gaps? Use this intelligence to improve your offering and help the ISP compete better.

Measuring Retention: Metrics That Signal Trouble

By the time an ISP announces they’re leaving, the damage is done. Early warning systems help you intervene before the exit conversation happens.

Track these retention signals monthly:

Partner NPS. Ask your ISP partners, “How likely are you to recommend this partnership to other ISPs?” An NPS above 50 is healthy; below 30 signals serious problems. Follow up with losers (those rating below 6) to understand what’s broken.

Engagement metrics. Are your partner contacts attending QBRs? Responding to outreach? Engaging with your product roadmap? Declining engagement often precedes a breakup.

Revenue per partner trend. Is wholesale revenue per ISP growing, flat, or declining? A declining trend means fewer customers, which signals either churn at the ISP or the partner redirecting their sales focus elsewhere.

Customer win/loss by partner. Which ISPs are growing customers on your network? Which are losing them? If one ISP is dramatically outperforming another, the underperformer may be losing confidence (either in your network or in their own ability to compete).

Support ticket patterns. A sudden spike in escalations often precedes churn. Conversely, partners who never escalate may be quietly giving up on your network.

Your First 90 Days With a New ISP Partner

90-day ISP partnership onboarding timeline showing four phases: technical onboarding weeks 1-2, commercial setup weeks 2-4, joint business plan weeks 4-8, and first quick win weeks 8-12

The foundation of retention is set in the first quarter. New partnerships that stumble here rarely recover.

Weeks 1-2: Technical onboarding. Your partner success lead and the ISP’s technical team should work through a detailed integration checklist. How do their systems connect to yours? What’s the provisioning process? What happens when a customer cancels? Leave no ambiguity.

Weeks 2-4: Commercial setup. Ensure the ISP’s billing team can process invoices. Set up reporting so they can see real-time revenue and customer metrics. Establish escalation contacts at your NOC and theirs.

Weeks 4-8: First joint business plan. Sit down with the ISP’s leadership and agree on year-one targets: customer additions, take-rate on the network, any co-marketing initiatives. Write it down. This becomes your shared scorecard.

Weeks 8-12: First quick win. Launch something together early. Maybe it’s a bundle promotion, a speed tier upgrade, or a marketing campaign. The goal is to prove the partnership works and build momentum before market headwinds hit.

For a deeper dive into how to structure open-access networks to support partnership success, review our guide on the open-access FTTH model. The core idea: your network architecture should enable, not constrain, ISP differentiation.

Conclusion: Structure Beats Execution

FTTH operators often assume that good partnerships are the result of good salespeople or good relationships. In reality, they’re the result of good structure.

If your contracts lack clarity on margins and escalation, no amount of friendliness fixes the partnership. If your revenue model doesn’t allow ISPs to build sustainable businesses, they will leave. If your operational infrastructure doesn’t support partner success, you’ve handed the advantage to competitors who do.

The partnerships that last 7+ years are built on aligned incentives, transparent communication, and operational excellence. They’re boring. They’re unsexy. And they’re profoundly profitable.

Your next step: Audit your current ISP partnership agreements against the three pillars outlined here—contract clarity, revenue model alignment, and operational support. Where are the gaps? Which partnership is at the highest risk? Start there.

The Complete FTTH Technician Checklist: From Planning to Deployment

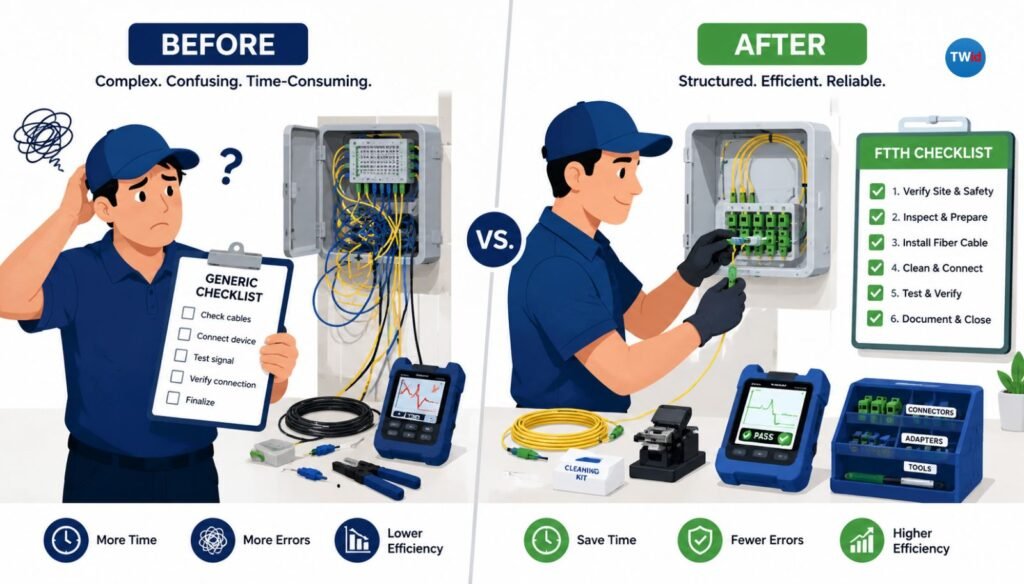
FTTH Technician checklist from planning and deployment phase

FTTH deployment projects fail in the details. A missed cable specification, skipped testing step, or poor documentation during installation doesn’t just cost time—it compounds into service delays, customer churn, and expensive rework months later.

Having an FTTH technician checklist that covers every phase from planning through handover isn’t a luxury. It’s the difference between on-time, on-budget projects and costly operational disasters.

This guide gives you the end-to-end checklist framework that field teams, project managers, and operators use to execute flawless fiber deployments. Whether you’re managing a single neighborhood build or a multi-phase regional rollout, this checklist ensures nothing falls through the cracks.

Why an FTTH Checklist Matters (Pre-Deployment Success)

The fiber industry runs on tight margins. A single day of deployment delay costs operators $50,000 or more in labor, equipment staging, and opportunity cost. Yet most delays don’t come from unpredictable events—they come from missing steps, inconsistent processes, and technicians working from fragmented guidance.

When quality gaps slip through installation, they multiply post-launch. A cold solder joint discovered during activation testing can require splicing crews to return to the field. Improper cable slack discovered after weather events means expensive reinstalls. Poor documentation forces operations teams to reverse-engineer network configurations.

A unified, phase-based FTTH technician checklist eliminates these blind spots. It standardizes what “done” looks like at each stage, reduces rework by 20-30%, and compresses project timelines because crews know exactly what to verify before moving forward.

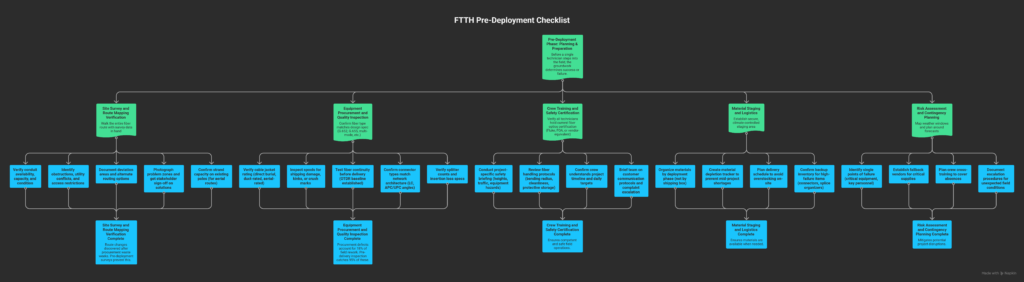
Pre-Deployment Phase: Planning & Preparation

FTTH deployment planning phase showing technician with site survey map, conduit route verification, equipment procurement checklist, and crew training materials for fiber-to-the-home installation

Before a single technician steps into the field, the groundwork determines success or failure.

Site Survey and Route Mapping Verification

  • [ ] Walk the entire fiber route with survey data in hand
  • [ ] Verify conduit availability, capacity, and condition
  • [ ] Identify obstructions, utility conflicts, and access restrictions
  • [ ] Document deviation areas and alternate routing options
  • [ ] Photograph problem zones and get stakeholder sign-off on solutions
  • [ ] Confirm strand capacity on existing poles (for aerial routes)

Why it matters: Route changes discovered after procurement waste weeks. Pre-deployment surveys prevent this.

Equipment Procurement and Quality Inspection

  • [ ] Confirm fiber type matches design spec (G.652, G.655, multi-mode, etc.)
  • [ ] Verify cable jacket rating (direct burial, duct-rated, aerial-rated)
  • [ ] Inspect spools for shipping damage, kinks, or crush marks
  • [ ] Test fiber continuity before delivery (OTDR baseline established)
  • [ ] Confirm connector types match network architecture (LC, APC/UPC angles)
  • [ ] Verify splitter counts and insertion loss specs

Industry standard: According to Telecompetitor research on fiber quality issues, procurement defects account for 18% of field rework. Pre-delivery inspection catches 95% of these.

Crew Training and Safety Certification

  • [ ] Verify all technicians hold current fiber optics certification (Fluke, FOA, or vendor-equivalent)
  • [ ] Conduct project-specific safety briefing (heights, traffic, equipment hazards)
  • [ ] Review fiber handling protocols (bending radius, cleanliness, protective storage)
  • [ ] Confirm crew understands project timeline and daily targets
  • [ ] Brief team on customer communication protocols and complaint escalation

Material Staging and Logistics

  • [ ] Establish secure, climate-controlled staging area
  • [ ] Organize materials by deployment phase (not by shipping box)
  • [ ] Create material depletion tracker to prevent mid-project shortages
  • [ ] Plan delivery schedule to avoid overstocking on-site
  • [ ] Confirm backup inventory for high-failure items (connectors, splice organizers)

Risk Assessment and Contingency Planning

  • [ ] Map weather windows and plan around forecasts
  • [ ] Identify single points of failure (critical equipment, key personnel)
  • [ ] Establish fallback vendors for critical supplies
  • [ ] Plan crew cross-training to cover absences
  • [ ] Document escalation procedures for unexpected field conditions

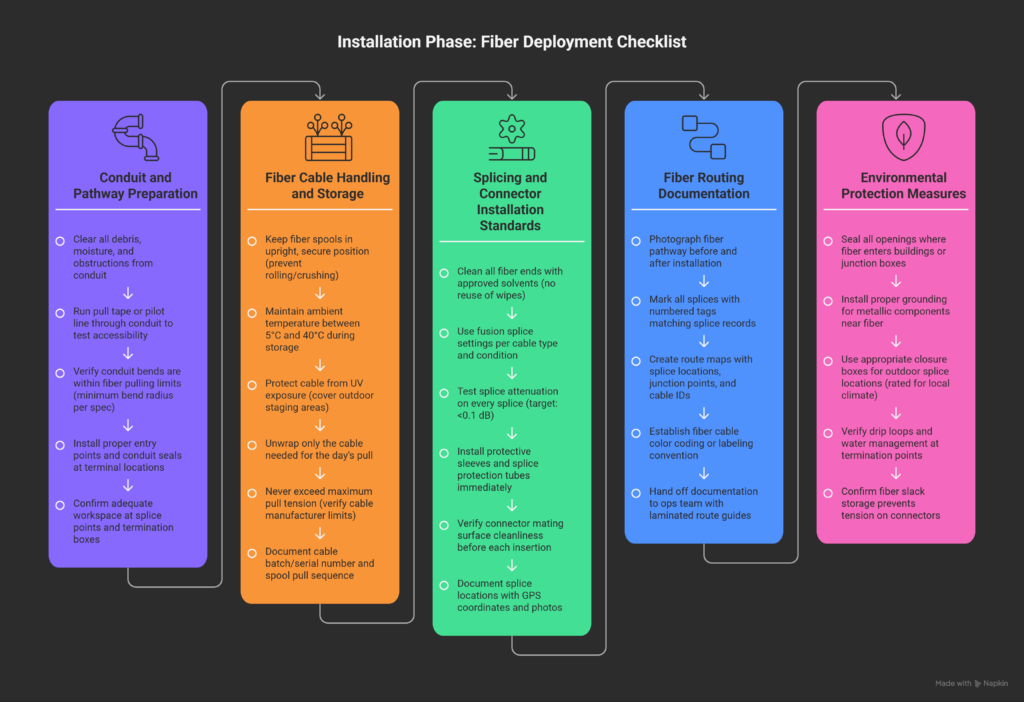
Installation Phase: Fiber Deployment Checklist

Infographic of FTTH fiber deployment installation phase showing six interconnected steps: conduit and pathway preparation with debris clearing and bend radius verification, fiber cable handling and storage in climate-controlled environment with proper spool positioning, splicing and connector installation with fusion splice testing and protective sleeves, fiber routing documentation with GPS coordinates and labeled splice locations, and environmental protection measures including sealing, grounding, and water management - each step illustrated with technician performing task, equipment used, and checklist verification marks indicating completed requirements for successful fiber-to-the-home network deployment

This is where the physical network comes to life. Installation quality directly determines operational reliability.

Conduit and Pathway Preparation

  • [ ] Clear all debris, moisture, and obstructions from conduit
  • [ ] Run pull tape or pilot line through conduit to test accessibility
  • [ ] Verify conduit bends are within fiber pulling limits (minimum bend radius per spec)
  • [ ] Install proper entry points and conduit seals at terminal locations
  • [ ] Confirm adequate workspace at splice points and termination boxes

Fiber Cable Handling and Storage

  • [ ] Keep fiber spools in upright, secure position (prevent rolling/crushing)
  • [ ] Maintain ambient temperature between 5°C and 40°C during storage
  • [ ] Protect cable from UV exposure (cover outdoor staging areas)
  • [ ] Unwrap only the cable needed for the day’s pull
  • [ ] Never exceed maximum pull tension (verify cable manufacturer limits)
  • [ ] Document cable batch/serial number and spool pull sequence

Splicing and Connector Installation Standards

  • [ ] Clean all fiber ends with approved solvents (no reuse of wipes)
  • [ ] Use fusion splice settings per cable type and condition
  • [ ] Test splice attenuation on every splice (target: <0.1 dB)
  • [ ] Install protective sleeves and splice protection tubes immediately
  • [ ] Verify connector mating surface cleanliness before each insertion
  • [ ] Document splice locations with GPS coordinates and photos

Best practice: Fiber splicing errors account for 40% of field rework (per Light Reading industry analysis). Verification at splice time eliminates 95% of post-activation issues.

Fiber Routing Documentation

  • [ ] Photograph fiber pathway before and after installation
  • [ ] Mark all splices with numbered tags matching splice records
  • [ ] Create route maps with splice locations, junction points, and cable IDs
  • [ ] Establish fiber cable color coding or labeling convention
  • [ ] Hand off documentation to ops team with laminated route guides

Environmental Protection Measures

  • [ ] Seal all openings where fiber enters buildings or junction boxes
  • [ ] Install proper grounding for metallic components near fiber
  • [ ] Use appropriate closure boxes for outdoor splice locations (rated for local climate)
  • [ ] Verify drip loops and water management at termination points
  • [ ] Confirm fiber slack storage prevents tension on connectors

Testing & Validation Phase: Field Testing Checklist

You can’t activate what you haven’t validated. Testing is where deployment quality becomes measurable.

Optical Time-Domain Reflectometer (OTDR) Testing

  • [ ] Capture OTDR baseline from both directions on each fiber
  • [ ] Document launch conditions and test wavelength (1310 nm, 1550 nm, or both)
  • [ ] Identify all events (splices, connectors, bends) and mark on map
  • [ ] Compare to pre-installation baseline and design specifications
  • [ ] Flag any unexpected events or attenuation spikes
  • [ ] Archive OTDR files with timestamp and technician name

Continuity and Loss Verification

  • [ ] Verify continuity on every core with light source and power meter
  • [ ] Test from both fiber ends (confirms no directional issues)
  • [ ] Record insertion loss at each termination point
  • [ ] Verify loss within specification before activation
  • [ ] Document any cores with unacceptable loss and schedule rework

Insertion Loss and Return Loss Measurements

  • [ ] Calibrate power meter and light source daily (reference standard)
  • [ ] Measure loss at each splice and connector with proper jumpers
  • [ ] Record both UPC and APC measurements if mixed connector types exist
  • [ ] Verify total link loss is within budget (design target + 2 dB margin)
  • [ ] Confirm return loss meets spec for networks using Raman amplification

Power Meter and Light Source Validation

  • [ ] Test meters and sources with known reference cables daily
  • [ ] Verify battery condition and charge levels before field deployment
  • [ ] Confirm wavelength accuracy (±5 nm tolerance)
  • [ ] Document equipment serial numbers and calibration dates
  • [ ] Maintain calibration certificates on-site

Testing Documentation Requirements

  • [ ] Create test report with project name, date, technician, and weather conditions
  • [ ] Include OTDR trace files and power meter readings (attach or reference)
  • [ ] Record acceptance criteria and test result status (Pass/Fail)
  • [ ] Document any failed tests and planned remediation
  • [ ] Obtain customer or project manager sign-off on test results

Handover & Commissioning Phase

Installation is complete. Now comes the handover that determines whether the network actually works in production.

Network Activation Procedures

  • [ ] Coordinate activation window with all stakeholders (NOC, field team, customer)
  • [ ] Power on OLT (optical line terminal) and confirm startup diagnostics
  • [ ] Verify transceiver signal levels within acceptable range
  • [ ] Activate ONTs (optical network terminals) in sequence, not all at once
  • [ ] Confirm no alarm conditions in element management system

Customer CPE Installation and Configuration

  • [ ] Install ONT at customer premises per design specs (indoor/outdoor)
  • [ ] Verify fiber routing avoids stress on customer equipment
  • [ ] Configure ONT with correct provisioning credentials
  • [ ] Test downstream and upstream signal quality at customer location
  • [ ] Leave customer with clear documentation on equipment location and reset procedures

Service Activation Testing

  • [ ] Verify downstream power levels on each ONT (17-26 dBm typical range)
  • [ ] Confirm upstream power levels stay within limits (0-+6 dBm typical)
  • [ ] Test broadband speed (verify against SLA commitment)
  • [ ] Confirm VOIP dial tone and call completion (if bundled)
  • [ ] Verify IPTV video quality and channel load times (if bundled)
  • [ ] Document any service issues and escalate to NOC

Documentation Handover to Operations

  • [ ] Deliver complete as-built route maps and splice records
  • [ ] Hand off OTDR traces and test reports in searchable archive
  • [ ] Provide ONT provisioning file exports and activation credentials
  • [ ] Create runbook for common troubleshooting scenarios
  • [ ] Schedule knowledge transfer call with ops team

Punch-List Closure and Final Sign-Off

  • [ ] Identify any incomplete items or deferred work
  • [ ] Schedule rework with clear completion deadline
  • [ ] Obtain customer and project manager sign-off on all complete sections
  • [ ] Document any customer concerns or requested follow-ups
  • [ ] Confirm payment authorization once all items are closed

Common FTTH Deployment Mistakes (And How to Avoid Them)

Field teams make the same mistakes repeatedly because they’re not always obvious until the damage is done.

Over-Tightening Connectors Every connector has a torque spec (usually 0.5–1.5 Nm). Over-tightening crushes ferrules and introduces micro-cracks that show up as high loss. Use a torque wrench, not feel.

Insufficient Cable Slack Allowances Fiber doesn’t compress. When ambient temperature drops, tight installations go into tension and connectors break. Always install 5–10% slack in outdoor routes.

Skipping Environmental Sealing Steps Water ingress and UV exposure are silent killers. Unsealed splice boxes fail mysteriously after 6–12 months. Seal everything the first time.

Poor Documentation Practices Operations inherits a black box. Without clear splice maps and fiber records, rework becomes guesswork. Document at installation, not after.

Inadequate Crew Coordination Splicing happens in one location while testing happens elsewhere. If teams don’t sync, defects slip past discovery. Daily stand-ups and real-time status updates prevent this.

Tools & Resources to Streamline Your FTTH Checklist

Modern deployment doesn’t happen on paper anymore.

Mobile Field Documentation Apps Real-time apps let technicians log checklist items, capture photos, and store OTDR files directly in the cloud. This eliminates end-of-day data entry and keeps information accessible.

Automated Checklist Generators Manually building checklists for every project invites inconsistency. A proper framework tool generates project-specific checklists based on network design, deployment scope, and equipment type. Many teams use automated technician checklist generators to standardize their process and reduce training burden.

Integration with Project Management Platforms Connect your field checklist system to Asana, Monday.com, or equivalent. This creates automatic work orders, tracks crew productivity, and feeds real-time status to leadership dashboards.

Industry Standards and References

  • TIA-604 (Fiber Optic Connector Intermateability Standards)
  • IEC 60794 (Optical Fiber Cable Specifications)
  • Telecom Standards Body (TSB) publications on FTTH deployment best practices

For operators working to increase customer take-rate after deployment, understanding the technical foundation improves customer confidence and reduces churn. Learn how operators increase take-rate through better service quality and customer experience.

Your FTTH Deployment Starts This Week

You now have a framework that covers every phase of deployment: planning, installation, testing, and handover. The difference between a flawless deployment and a costly rework project is whether this checklist gets followed consistently.

Here’s what to do right now:

  1. Download or adapt this checklist for your next project
  2. Customize it for your specific equipment and network topology
  3. Train your team on each section before deployment begins
  4. Use the automated checklist generator to create role-specific versions for splicing crews, test teams, and installation teams

The best time to prevent a deployment disaster is before it happens. This checklist is your insurance policy.

FTTH Growth Strategy: How Fiber Operators Increase Take-Rate, ARPU, and Market Share

Here’s a number that should keep every fiber executive up at night: across Europe, only 53% of homes passed by fiber are actually connected. Nearly half of the capital deployed in FTTH infrastructure is sitting idle — generating zero revenue. And Europe isn’t unique. In competitive U.S. urban markets, take-rates often hover between 30% and 50%.

The gap between homes passed and homes connected is where FTTH growth strategy lives or dies. You can build the best fiber network on the planet, but if your take-rate stalls, your ARPU flatlines, and your competitors are chipping away at your addressable market, the economics fall apart fast.

This post breaks down the specific growth levers that high-performing fiber operators use to increase take-rate, expand ARPU, and capture lasting market share — backed by current industry data and real strategic frameworks.

The Take-Rate Problem Is a Revenue Problem

Let’s put the math in perspective. According to EY’s analysis of the U.S. FTTH market, build return minimums have risen from 8–10% in 2021 to 12–15% today, driven by interest rate shifts and competitive overbuild risk (EY — How US FTTH Providers Can Navigate an Evolving Market). That means the margin for error on take-rate has shrunk dramatically. Dense suburban and urban builds can still deliver high returns — but only when penetration and ARPU targets are met.

Every home passed but not connected is stranded capital. Fiber rollout is front-loaded in cost. Returns only materialize when customers migrate and pay. If your FTTH growth strategy doesn’t address the conversion gap, you’re essentially financing infrastructure for your competitors’ future customers.

The operators winning this race aren’t just building faster. They’re converting faster.

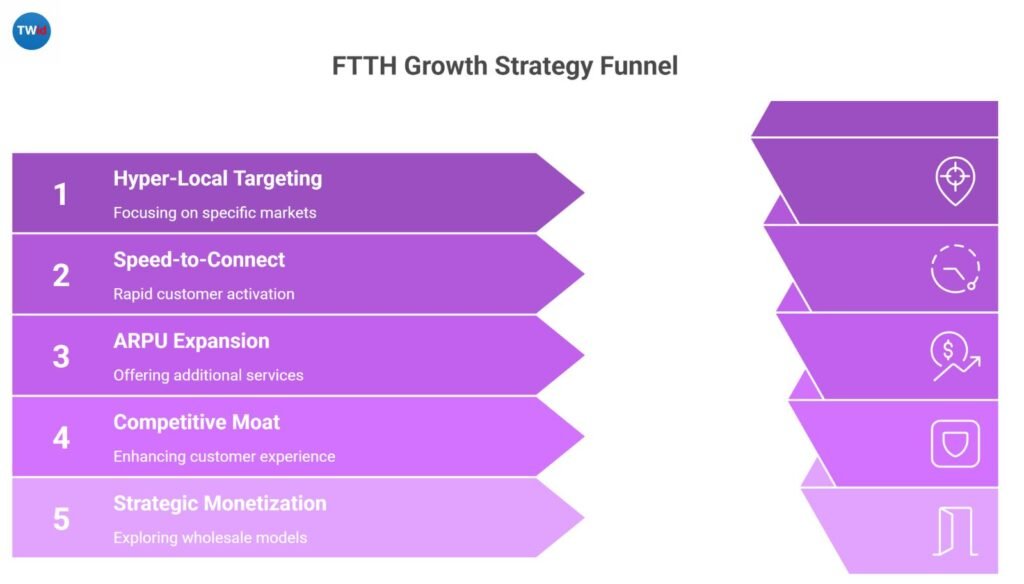
Five Growth Levers That Actually Move the Needle

Five key FTTH growth strategy levers including market targeting, speed to connect, ARPU expansion, service experience, and network monetization

1. Hyper-Local Market Targeting

The first lever in any serious FTTH growth strategy is getting granular about where you build and where you sell. Not every market delivers the same return profile, and blanket rollout strategies waste capital.

High-performing operators are building detailed, address-level targeting models that factor in competitive overlap, demographic profiles, housing density, and historical conversion rates. EY recommends what they call an “intentional market targeting plan” — one that carefully forecasts performance against current and potential future competitors at granular geographic levels.

The practical takeaway: stop thinking in city-wide deployment phases. Start thinking in micro-markets. Rank every cluster by expected take-rate, competitive intensity, and time-to-payback. Deploy sales resources accordingly.

2. Speed-to-Connect After Build Completion

The window between network availability and customer activation is critical. The longer a home sits “passed but not connected,” the harder conversion becomes. Inertia sets in. Competitors make offers. The moment of highest intent — when the fiber truck is on the street and neighbors are talking — fades.

Top operators are compressing the order-to-activation timeline to days, not weeks. They’re deploying pre-registration campaigns months before construction starts, running “fiber-ready” community events during build, and offering same-week installation once the network lights up.

Track your conversion rate within the first 90 days of availability. That single KPI tells you more about your FTTH growth strategy effectiveness than any annual take-rate number.

3. ARPU Expansion Beyond Baseline Broadband

Here’s where the revenue story gets interesting. According to Cartesian’s 2025 Communications Year-End Review, U.S. ISPs are shifting away from traditional promotional pricing toward multi-year price guarantees — trading some short-term ARPU upside for trust, lower churn, and long-term subscriber value (Cartesian — 2025 Year-End Review and 2026 Outlook).

Operators like AT&T and Spectrum are introducing enterprise-style service level agreements into the residential market, promising uptime thresholds and proactive outage credits.

This trend signals a fundamental shift in FTTH growth strategy thinking: ARPU growth increasingly comes from value differentiation, not just speed-tier upselling.

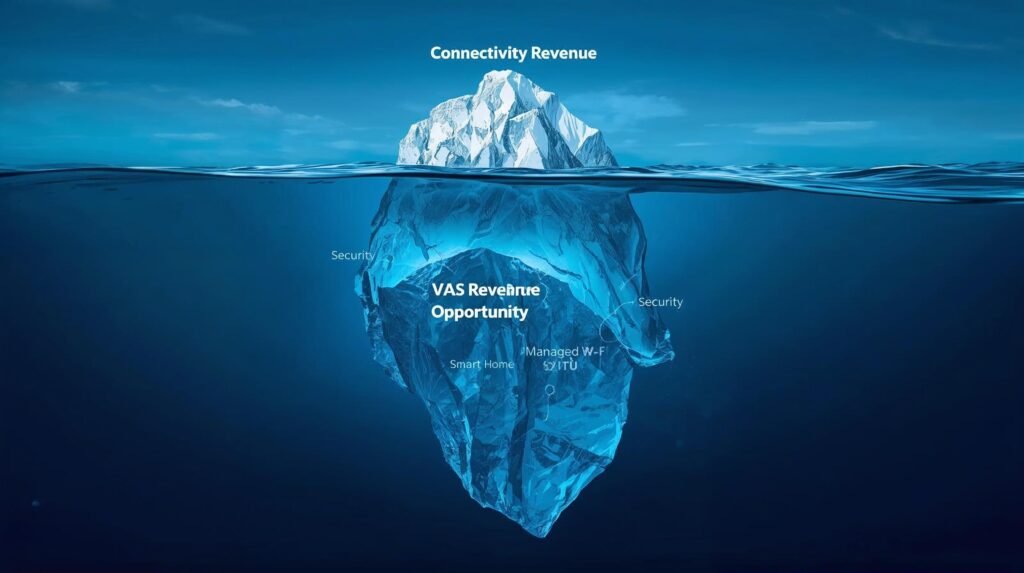
The smartest operators are layering revenue through whole-home Wi-Fi management services, cybersecurity packages, smart home bundles, and enterprise-edge connectivity products built on the same fiber infrastructure.

The AI boom, in particular, is creating demand for high-capacity edge connectivity in the same markets where residential fiber already exists — a meaningful ARPU expansion opportunity if you build the product and sales motion to capture it.

Understanding what drives customers to stay — and pay more — is equally critical. Retention and ARPU are inseparable. Operators who invest in customer retention strategy find that satisfaction with Wi-Fi experience and service reliability often matters more than price alone when it comes to preventing churn and sustaining ARPU growth.

4. Competitive Moat Through Service Experience

In markets where multiple fiber providers overlap — and that number is growing fast — the product itself becomes commoditized. Everyone offers gigabit. Everyone claims reliability. The differentiator becomes the experience layer.

This includes installation experience (was it fast, professional, and on-time?), customer support quality (can I reach someone who actually understands fiber?), proactive network management (do you tell me about issues before I notice them?), and transparent pricing (no surprise rate hikes at month 13).

Operators building a genuine service moat are investing in NPS tracking, technician quality programs, app-based customer management, and proactive communication during outages. These aren’t “nice to have” features. In an overbuilt market, they’re the difference between 40% take-rate and 60% take-rate.

5. Strategic Network Monetization Models

Not every home needs to be a retail customer for the infrastructure to generate returns. Operators exploring open-access and wholesale models are finding ways to monetize fiber capacity even when the end customer chooses a competitor’s brand.

In an open-access model, if a competing ISP acquires a customer over your network, you still earn wholesale fees. The customer is monetized regardless of retail brand preference. This transforms competition from zero-sum to collaborative at the infrastructure layer. Operators who understand open-access FTTH economics can unlock revenue from the same fiber plant that a vertically integrated retail model would leave dark.

This is especially relevant in markets where take-rate ceilings exist due to brand preference diversity. Rather than fighting for every retail customer, the infrastructure owner captures value from all providers on the platform.

Market Share Defense in an Overbuild Era

Fiber is now passing 58% of U.S. households — a 13% increase year over year, according to the Fiber Broadband Association. In Europe, FTTH coverage reached 77.2% of households in 2025. The build phase is maturing. The fight for market share is intensifying.

At the same time, fixed wireless access has emerged as a viable competitor, adding roughly two million U.S. subscribers in the first half of 2025 alone — outpacing fiber subscriber growth in some segments. Cable operators are bundling broadband with wireless service at aggressive discounts.

Your FTTH growth strategy needs a market share defense component that addresses three realities. First, new fiber entrants will continue entering your markets. Second, FWA will erode the bottom of your addressable base. Third, cable operators will fight harder as their competitive position weakens.

The operators holding market share are those who moved first on service differentiation, locked in customers with transparent multi-year pricing, and built a brand that customers trust enough to recommend.

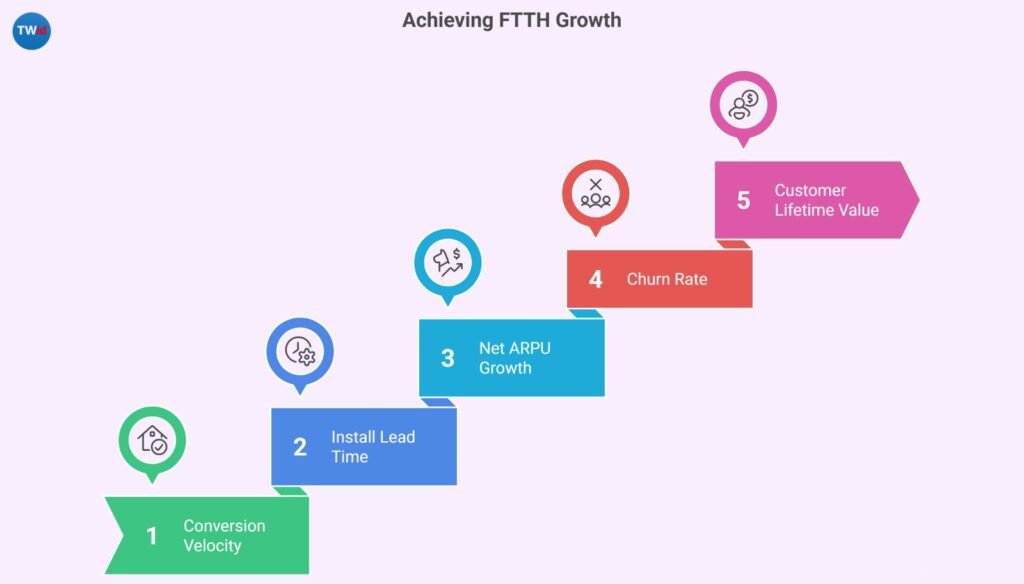
Building a Growth Metrics Framework

achieving ftth growth

Stop measuring success by homes passed alone. The operators executing the best FTTH growth strategies track a different set of KPIs.

Conversion velocity measures the percentage of homes passed that order service within 90 days of availability. Install lead time tracks average days from customer order to activated service. Net ARPU growth tracks revenue per user after accounting for promotional discounts and bundling.

Churn rate by cohort segments customers by acquisition date and competitive environment. Customer lifetime value calculates the full revenue potential of each subscriber over their expected tenure.

These metrics, tracked monthly and segmented by micro-market, give you the operational visibility to course-correct before a take-rate problem becomes a balance sheet problem.

The Bottom Line

The FTTH market is shifting from a build race to a monetization race. The operators who win the next five years won’t be those who passed the most homes. They’ll be the ones who converted the most homes, grew ARPU through value-layered services, and defended market share with experiences that customers can’t get from a wireless hotspot or a cable modem.

Audit your take-rate by micro-market this quarter. Identify where the conversion gap is widest and deploy resources there first. The infrastructure investment is already in the ground. The question is whether your FTTH growth strategy is turning that investment into sustainable revenue.

Frequently Asked Questions

What is an FTTH growth strategy?

An FTTH growth strategy is the operational and commercial playbook a fiber operator uses to increase subscriber take-rate, grow average revenue per user (ARPU), and expand market share after network deployment. It encompasses market targeting, customer acquisition, pricing models, service differentiation, and network monetization — all focused on converting infrastructure investment into recurring revenue.

What is a good take-rate for FTTH operators?

Take-rates vary significantly by market and competitive environment. In competitive urban markets, take-rates typically range from 30% to 50%. In less competitive or subsidy-supported rural markets, mature operators can achieve 60% or higher. The critical metric isn’t just the final take-rate — it’s the conversion velocity within the first 90 days of network availability, which predicts long-term penetration.

How can fiber operators increase ARPU without raising prices?

The most effective ARPU growth strategies involve layering value-added services on top of baseline broadband. This includes managed Wi-Fi services, cybersecurity packages, smart home bundles, and enterprise-edge connectivity products. Operators are also shifting from promotional pricing to transparent multi-year price guarantees, which stabilize ARPU over time and reduce churn-driven revenue volatility.

How does fixed wireless access (FWA) impact FTTH market share?

FWA has emerged as a meaningful competitive force, particularly at the lower end of the broadband market. In the U.S., FWA added roughly two million subscribers in the first half of 2025, outpacing fiber growth in some segments.

Fiber operators counter FWA competition by emphasizing symmetrical speeds, dedicated connections, lower latency, and long-term reliability — advantages that become more pronounced as household bandwidth demand increases.

Should FTTH operators consider open-access models for growth?

Open-access models can be a powerful growth lever, particularly in markets where single-operator retail take-rates hit a ceiling. By allowing multiple ISPs to serve customers on the same fiber infrastructure, the network owner earns wholesale fees regardless of which retail brand the customer selects. This approach transforms competition from zero-sum to collaborative at the infrastructure layer and can significantly improve network utilization and revenue yield.

What Drives FTTH Retention More: Price, Reliability, or Wi-Fi Experience?

You just passed 50,000 homes. Your take rate is climbing. The board is happy.

Then Q3 hits, and your churn report tells a different story. Subscribers are leaving — not to a cheaper competitor, but to one that “just works better at home.” Your FTTH retention strategy, if you even have one, is bleeding revenue faster than your acquisition engine can replace it.

Here is the uncomfortable truth most fiber operators avoid: acquiring a broadband subscriber costs roughly five times more than keeping one. Yet the overwhelming majority of FTTH operators still allocate 80% or more of their commercial budget to acquisition and less than 20% to retention. That math does not hold up when monthly churn compounds over a 36-month payback period.

So what actually keeps a fiber subscriber loyal? Is it the monthly price tag? Network uptime? Or the Wi-Fi experience inside their home — the thing your network operations center cannot even see?

Let us break it down with data.

Price: The Loudest Factor, but Not the Strongest

FTTH retention strategy infographic showing churn triggers including price hikes reliability issues and Wi-Fi dead zones

Price dominates every customer satisfaction survey headline. According to research across European telecom markets, price is the single most cited reason consumers switch fixed broadband providers. In the U.S., a 2024 study by Recurly found that 71% of respondents named price increases as the top reason for canceling subscriptions. It is hard to argue with numbers like that.

But here is where FTTH executives need to read the fine print.

Price sensitivity is highest during two moments: the initial purchase decision and the post-promotional price jump. Outside of those windows, price drops significantly as a churn driver — especially for fiber subscribers.

The EY analysis of the U.S. FTTH market points out that transparent, guaranteed pricing through fixed contract terms builds trust and brand loyalty far more effectively than promotional discounts. Cost-conscious consumers respond better to pricing clarity than to the lowest number on the page.

In other words, the operators losing subscribers to “price” are often not losing on price at all. They are losing on pricing transparency — hidden fees, surprise rate hikes after the first year, and equipment rental charges that feel like a bait-and-switch.

What Smart Operators Are Doing About Price

The leading FTTH providers are not racing to the bottom on price. Instead, they are removing pricing friction. Multi-year price locks, transparent all-in billing, and tiered plans that match household usage patterns are proving more effective at retention than reactive discount offers. When a subscriber calls to cancel and gets a 20% discount, that is not a retention strategy — that is a confession that the original price was wrong.

Reliability: The Silent Loyalty Builder

If price is the loudest churn driver, reliability is the quietest retention driver. Subscribers rarely call to say “great uptime this month.” But they absolutely notice when the connection drops during a video call with their CEO or when their kid’s online exam freezes mid-session.

The data supports this. The Broadband Customer Satisfaction Report for 2025 found that ISPs maintaining network uptime above 99.95% received satisfaction scores 24% higher than those with lower reliability. Among fiber subscribers specifically, 87% of households with three or more simultaneous users reported zero slowdowns — compared to just 63% of cable subscribers. That reliability gap is one of fiber’s strongest competitive moats.

The JD Power 2025 U.S. Residential Internet Service Provider Satisfaction Study reinforced this point. Satisfaction is built on seven dimensions, and “consistently delivering high-quality service” sits at the top. Speed matters, but speed without consistency is just a marketing number.

For FTTH operators building a long-term retention strategy, reliability is the foundation. If your network goes down twice a month, no pricing trick or Wi-Fi upgrade will save your subscriber base. This is especially relevant as operators adopt AI-driven automation for fault management — proactive detection and resolution of network issues before subscribers even notice them.

The Reliability Benchmark You Should Be Tracking

Forget average uptime. Track “subscriber-impacting events per month” — the number of times an individual household experiences a service interruption, regardless of duration. The industry average sits around 1.9 events per month. Leading fiber operators target fewer than 0.5. That gap is where loyalty is won or lost.

Wi-Fi Experience: The Retention Battleground Operators Are Ignoring

Here is where the conversation gets interesting — and where most FTTH operators have a massive blind spot.

Parks Associates and TechSee research study surveying 8,000 U.S. households found that in-home Wi-Fi performance — not broadband speed — is what actually drives customer satisfaction, loyalty, and churn risk. Despite over 25% of households reporting gigabit-speed service, satisfaction was driven as much by perceived performance as by raw download speeds. Even more telling: 40% of smart device owners reported frequent Wi-Fi connectivity loss affecting their overall network experience.

Think about what that means for your FTTH retention strategy. You can deliver a flawless 1 Gbps connection to the ONT on the side of the house, and your subscriber still experiences buffering in the bedroom, dropped connections in the home office, and smart home devices that randomly go offline. From their perspective, your service is unreliable. They do not care that the problem is their router or the physical layout of their home. They care that it does not work.

This perception gap is the single biggest unaddressed vulnerability in most FTTH retention strategies.

Why Wi-Fi Is Now an Operator Problem

The traditional industry position has been that the home Wi-Fi environment is the subscriber’s responsibility. That position is becoming commercially untenable. As the Dell’Oro Group noted in their 2026 broadband predictions, the competitive battleground is shifting from headline speeds to experiential quality.

Operators that invest in reducing latency, minimizing jitter, and ensuring rock-solid reliability throughout the home — not just to the premises — will build competitive advantages that are much harder to replicate.

Leading operators are already making this shift. Managed Wi-Fi services, mesh network solutions bundled with fiber plans, proactive Wi-Fi diagnostics, and AI-powered network optimization within the home are becoming standard tools in the FTTH retention playbook.

Operators that can “see” inside the home network and resolve issues before the subscriber picks up the phone are dramatically reducing truck rolls, support costs, and — most importantly — churn.

This shift also connects directly to how operators structure their revenue models on open-access networks. When multiple ISPs compete on the same fiber infrastructure, the differentiator is no longer the pipe — it is the experience delivered through it.

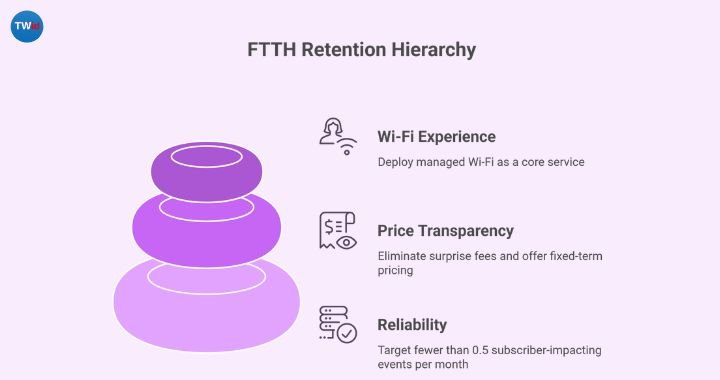
The Retention Hierarchy: How All Three Factors Work Together

FTTH retention strategy pyramid showing reliability as foundation layer price transparency as middle layer and Wi-Fi experience as top competitive differentiator

So which factor matters most? The answer is not one over the other — it is about sequencing.

Think of FTTH retention as a hierarchy. Reliability is the foundation. Without it, nothing else matters. Price transparency is the second layer — subscribers need to feel the value is fair and predictable. Wi-Fi experience is the top layer — and increasingly, it is the one that separates operators who retain 95% of subscribers from those stuck at 85%.

Here is a practical framework for FTTH executives building a retention strategy:

Layer 1 — Reliability: Target fewer than 0.5 subscriber-impacting events per month. Invest in proactive monitoring, predictive maintenance, and automated fault resolution. This is table stakes.

Layer 2 — Price Transparency: Eliminate surprise fees. Offer fixed-term pricing guarantees. Align plan tiers to actual household usage rather than aspirational speed benchmarks. Stop training subscribers to call and threaten cancellation for a discount.

Layer 3 — Wi-Fi Experience: Deploy managed Wi-Fi as a core service, not an upsell. Use AI-driven diagnostics to identify and resolve in-home connectivity issues proactively. Measure subscriber experience at the device level, not at the ONT.

What This Means for Your 2026 Retention Budget

If your current FTTH retention strategy is built around reactive discount offers and a customer service hotline, you are fighting with 2018 tools in a 2026 market. The operators that will win on retention are the ones investing in three capabilities: network intelligence that prevents outages before they happen, pricing models that build trust rather than trap subscribers, and in-home Wi-Fi management that makes the subscriber’s entire connected experience seamless.

The ROI case is straightforward. Reducing monthly churn by even 0.5 percentage points on a 100,000-subscriber base translates to 6,000 fewer lost subscribers per year. At a lifetime value of $2,000-$3,000 per subscriber, that is $12-18 million in preserved revenue — far exceeding the cost of a managed Wi-Fi program or a predictive maintenance platform.

Stop treating retention as a cost center. Start treating it as the single highest-ROI investment in your FTTH operation.

Audit your current retention stack this week. Map where your subscribers are actually churning — is it price, reliability, or the in-home experience? Then allocate your next budget cycle accordingly. The data says most of you are underinvesting in Wi-Fi experience. Fix that, and the numbers will follow.

Frequently Asked Questions

What is the average churn rate for FTTH providers?

FTTH providers typically see monthly churn rates between 1.0% and 2.5%, depending on market maturity, competitive intensity, and contract structures. Operators with strong retention programs — including managed Wi-Fi and proactive reliability monitoring — can push monthly churn below 1.0%.

In contrast, operators relying solely on promotional pricing often experience churn at the higher end of this range, particularly after initial contract terms expire.

How does Wi-Fi experience affect FTTH subscriber retention?

Wi-Fi experience has become one of the most significant — and most overlooked — drivers of FTTH churn. Research from Parks Associates found that 40% of smart device owners experience frequent Wi-Fi connectivity loss, and subscribers consistently blame their internet provider for in-home Wi-Fi issues, even when the fiber connection itself is performing perfectly. Operators deploying managed Wi-Fi solutions and proactive diagnostics are seeing measurable reductions in both support calls and subscriber churn.

What is more important for FTTH retention — price or reliability?

Both matter, but reliability is the stronger long-term retention driver. Price sensitivity is highest at the point of purchase and during post-promotional increases, but reliability complaints compound over time and erode trust. ISPs with network uptime above 99.95% consistently score 24% higher in customer satisfaction than those with more frequent outages.

The most effective retention strategies address reliability first, then build pricing transparency on top of that foundation.

How can FTTH operators reduce churn without lowering prices?

The most impactful non-price retention levers include deploying proactive network monitoring that resolves issues before subscribers notice them, offering managed Wi-Fi services that ensure consistent performance throughout the home, providing transparent and predictable billing with no hidden fees, and investing in self-service tools that give subscribers visibility into their own network performance.

Bundling value-added services like cybersecurity protection and parental controls can also increase perceived value without discounting the core service.

What metrics should FTTH operators track to measure retention effectiveness?

Beyond monthly churn rate, effective FTTH retention measurement includes subscriber-impacting events per month (target below 0.5), Net Promoter Score segmented by tenure cohort, support ticket volume per subscriber, time-to-resolution for reported issues, and the ratio of proactive fixes to reactive support calls.

Operators should also track “silent churn indicators” — subscribers who reduce usage or stop engaging with self-service portals — as these often precede cancellation by 30-60 days.

Why a Fiber Optic Copywriter Is the Competitive Edge FTTH Executives Are Overlooking

Expert Fiber Optic copywriter, help your FTTH business shinning.

The global FTTH market was valued at $56 billion in 2024 and is racing toward $110 billion by 2030. Deployment records are being broken every year. Capital is flowing in. Infrastructure is scaling fast.

And yet — most fiber operators still sound exactly the same when they talk to investors, partners, and prospective customers.

That’s the gap a skilled fiber optic copywriter closes. Not a generalist content vendor who learns the industry from a Wikipedia article, but a specialist who understands passive optical networks, take-rate economics, and the competitive dynamics of overbuilding markets — and can translate all of it into words that move the right people to act.

If you’re a C-suite executive or infrastructure investment lead navigating FTTH growth, this post breaks down exactly what this role involves, why it matters now more than ever, and how to find or evaluate one.

What a Fiber Optic Copywriter Actually Does (And What They Don’t)

Let’s clear something up: a fiber optic copywriter is not a technical writer producing installation manuals. And they’re not a general marketing copywriter who can be briefed on PON architecture in a 30-minute call.

This is a specialist who operates at the intersection of technical fluency and strategic communication. Their core job is to take complex FTTH concepts — deployment frameworks, open-access economics, ROI models — and transform them into clear, credible, and compelling content that resonates with your target audience.

What they typically produce:

  • Executive thought leadership articles and LinkedIn content
  • Investor decks and white papers explaining FTTH business cases
  • Website copy for ISPs, network operators, and infrastructure funds
  • Case studies and deal narratives for RFPs and procurement processes
  • Email campaigns targeting enterprise and government buyers
  • Technical blog posts that build authority with engineering and procurement audiences

The key differentiator is credibility. When your content accurately references XGS-PON upgrade paths, discusses the economics of open-access versus retail models, or addresses real deployment cost pressures — readers who know the industry feel it. That trust converts.

Why Generalist Copywriters Can’t Fill This Role?

Fiber optic copywriter comparing generic content with specialized FTTH industry writing"

Here’s the honest reality: most copywriters will agree to write about FTTH, then deliver content that’s structurally fine and factually hollow.

They’ll write “fiber optic networks deliver faster speeds” when your audience already knows that. They won’t write about the trade-offs between GPON and XGS-PON when upgrading capacity in a dense urban deployment. They won’t frame a funding pitch in terms of BEAD compliance and IRR sensitivities.

The FTTH industry has a sophisticated readership. Your buyers — whether they’re telecom procurement teams, PE fund managers, or municipal broadband leads — can spot surface-level content immediately. And when they do, it reflects on your brand’s credibility, not just your marketing department.

A fiber optic copywriter brings domain knowledge that eliminates this risk. They’ve absorbed the regulatory landscape, understand the vendor ecosystem, and know why take rates matter more than homes passed when evaluating a deployment’s commercial success.

The Market Opportunity That Makes Specialized FTTH Content Critical Right Now

The numbers explain the urgency.

According to the Fiber Broadband Association’s 2025 Annual Deployment Survey, the U.S. fiber industry passed 11.8 million additional homes in 2025 alone — bringing the national total to 98.3 million passings. Fiber now reaches over 60% of U.S. households.

Meanwhile, Grand View Research projects the global FTTH market to grow at a 12.4% CAGR from 2025 to 2030, reaching $110.44 billion. The restoration of 100% bonus depreciation in 2026 is expected to fuel a 5–15% increase in FTTH capital expenditure.

What this means in practical terms: competition for capital, talent, partnerships, and customers is intensifying at every level of the fiber stack. Operators that communicate their value clearly — to investors, to municipalities, to enterprise buyers — will command better terms, faster deal cycles, and stronger brand positioning.

Content is no longer a “nice to have” in this environment. It’s a commercial tool. And a fiber optic copywriter who understands how to frame your competitive positioning is the person who makes that tool sharp.

Four Qualities That Separate Elite FTTH Copywriters From Average Ones

When you’re evaluating a fiber optic copywriter — whether to hire one, contract one, or work with a ghostwriter who specializes in the space — here’s what to look for:

1. Demonstrated technical fluency They should be able to discuss the difference between GPON and XGS-PON without prompting, understand what open-access means for revenue yield, and know what ARPU optimization looks like in a mature fiber market. Ask them a technical question early in your evaluation. If they can’t go deep, they’ll produce shallow content.

2. Audience awareness at the executive level Strong FTTH copywriters write differently for a CFO than for a network operations director. They understand that an investment committee wants IRR and payback period framing, while a CTO wants architectural clarity. Tone, vocabulary, and emphasis shift accordingly.

3. A track record in regulated or capital-intensive industries FTTH isn’t just a technology play — it’s infrastructure, regulation, and capital allocation. Writers with backgrounds in energy infrastructure, regulated utilities, or structured finance often make the transition well. Their instincts for precision and risk-framing are already calibrated.

4. The ability to build narrative, not just explain features The best FTTH copywriters don’t just describe your product or service. They build a story about market inevitability, competitive moat, and strategic timing. This is the difference between content that informs and content that motivates.

How FTTH Operators Are Using Specialized Content Today?

Four ways fiber optic copywriters support FTTH operator strategy — from investor relations to government broadband grants

This isn’t theoretical. Operators and infrastructure investors are already using specialized content as a strategic lever — here’s how it typically plays out across the business:

Investor relations and capital raising: Detailed white papers and market positioning decks help PE firms and infrastructure funds understand why a specific operator’s deployment model, geography, or technology choices justify premium valuation.

Partnership development: ISPs entering open-access networks need to make a compelling case to network operators. Well-written partnership briefs and model explanations accelerate deal structuring. If you’re thinking through that dynamic, this breakdown of how to structure FTTH ISP partnerships on open-access networks is worth reviewing before your next conversation with a prospective partner.

Customer acquisition in overbuilt markets: As overbuild scenarios become more common, take-rate competition is real. Content that clearly communicates service quality differences, community investment, and long-term reliability — aimed at residential and enterprise buyers — directly influences subscriber adoption. This is especially relevant given the five strategic moves that win in overbuilt markets, where brand differentiation through content plays a measurable role.

Regulatory and government relations: Municipal broadband initiatives, BEAD grant applications, and state broadband office presentations all require clear, structured narrative. A fiber optic copywriter who understands government procurement language is an underutilized asset here.

What to Expect When You Engage a Fiber Optic Copywriter?

If you haven’t worked with a specialist FTTH writer before, here’s a realistic picture of the engagement:

Onboarding takes depth. A good fiber optic copywriter will ask detailed questions about your network architecture, target markets, competitive environment, and strategic priorities. This isn’t inefficiency — it’s how they produce content that sounds like it came from your organization, not a vendor.

Output cadence matters. For thought leadership programs, consistency beats volume. Three high-quality executive posts per month on LinkedIn, paired with one long-form article or white paper per quarter, typically outperforms a burst-and-fade content strategy.

Ghostwriting is the norm. Most senior executives in the FTTH space don’t write their own content — but they do own their ideas and positioning. A skilled fiber optic copywriter functions as a strategic ghostwriter: they interview you, extract your perspective, and produce content that reflects your voice at the quality level your reputation demands.

Measurement is possible. Unlike general PR, specialized content in FTTH produces trackable outcomes: inbound investor inquiries, speaking invitations, partnership conversations initiated by your content, and talent attraction from candidates who followed your thought leadership.

5 FAQs: Fiber Optic Copywriter

What’s the difference between a fiber optic copywriter and a telecom content writer?

A telecom content writer often covers the full spectrum of communications technology — mobile, cable, satellite, enterprise networking. A fiber optic copywriter is specifically focused on fiber infrastructure, which means deeper expertise in FTTH/FTTP deployment, passive optical networks, broadband economics, and the regulatory environment that governs fiber rollout. For FTTH executives and investors, this specialization produces materially better content outcomes.

Do I need a fiber optic copywriter on staff, or can I use a freelancer or ghostwriting service?

Most FTTH operators don’t need a full-time copywriter on staff. A specialized freelance ghostwriter or boutique content service that focuses on fiber and telecom infrastructure will typically deliver higher quality at better cost efficiency than a generalist marketing hire. The key is finding someone with verifiable FTTH knowledge — not just a content agency claiming “we work with tech clients.”

How does a fiber optic copywriter handle technical accuracy?

A strong specialist will establish a review process with your technical or product team before content goes live. They’ll flag assumptions, source claims from credible industry data, and build a fact-check step into the workflow. Many also maintain ongoing relationships with subject matter experts in network engineering and regulatory affairs to keep their knowledge current.

What budget should an FTTH operator expect for a specialized copywriter?

Rates vary by scope, but quality specialists who understand fiber infrastructure typically charge $150–$350 per hour for ghostwriting and strategic advisory work, or project rates starting around $1,500–$3,000 for a comprehensive white paper. Thought leadership retainers (monthly content packages) typically run $2,500–$6,000/month depending on volume and complexity. This is executive-level strategic communication — price accordingly.

How quickly can a fiber optic copywriter get up to speed on our specific operation?

A copywriter with existing FTTH expertise typically needs two to four weeks to understand your specific deployment model, competitive positioning, and voice before producing publication-ready content. This ramp period should include structured interviews with your technical leads and access to existing presentations or pitch materials. Don’t shortcut this — the onboarding investment pays back in content quality throughout the engagement.

Final Thought: The Fiber Industry Is Moving Fast. Your Communication Should Match.

The infrastructure race is real. Capital is competing for the best operators. Communities are evaluating which broadband provider to trust. Investors are comparing narratives as much as they’re comparing financials.

A fiber optic copywriter doesn’t just help you create content — they help you articulate why your approach to FTTH deployment, partnership structuring, and long-term network strategy is the right one for the market moment.

If your communication still sounds generic, it’s not reflecting what you actually know. And that gap is costing you opportunities.

Ready to build a content strategy that matches your infrastructure ambitions? Reach out to TheWriter.id and let’s talk about what specialized FTTH ghostwriting looks like for your organization.

How Open-Access FTTH Networks Improve Utilization and Revenue Yield

Generate revenue by utilize the open access FTTH network

If you’re a fiber operator sitting on a half-built network with a take-rate stuck below 35%, you already know the math isn’t working. The CapEx is sunk, the homes are passed, but the revenue is trickling in too slowly to satisfy your investors. What most operators don’t talk about loudly enough is that the business model — not the network — is often the real constraint.

That’s where open-access FTTH economics changes the conversation entirely.

Open-access isn’t just a regulatory compliance play. For operators who structure it correctly, it’s a deliberate strategy to drive higher network utilization, diversify revenue streams, and ultimately improve yield on a capital-intensive asset. This post breaks down how it works, what the data actually shows, and where operators tend to get it wrong.

The Utilization Problem at the Heart of FTTH Economics

Here’s the uncomfortable reality: most fiber networks are built to serve 100% of homes passed but monetized at a fraction of that capacity. The average take-rate in a competitive urban market sits somewhere between 30% and 50%. That means anywhere from half to two-thirds of your deployed fiber is generating zero revenue on any given day.

Traditional vertically integrated operators — those who build, operate, and retail on their own network — carry the full weight of customer acquisition, churn management, and service delivery on top of infrastructure costs. When take-rates lag, every piece of that stack bleeds margin.

The open-access model separates those layers. The network company (NetCo) owns and operates the physical infrastructure. Multiple service providers (ISPs) ride the network and compete for end-users.

The NetCo generates revenue from wholesale access fees, regardless of which ISP wins the customer. This is the structural shift that makes utilization economics genuinely different.

What Open-Access FTTH Economics Actually Means

Open Access FTTH Economics

Before we get into the revenue mechanics, let’s be precise about what we’re talking about. Open-access FTTH economics refers to the financial dynamics created when a fiber infrastructure is opened to multiple competing service providers under a wholesale access model.

The three-layer model looks like this:

  • Infrastructure Layer: Physical fiber, ducts, passive optical components — owned by the NetCo
  • Access Layer: Active electronics, network management, SLAs — operated by the NetCo or a neutral operator
  • Service Layer: ISP retail products, customer billing, marketing — owned by competing service providers

The revenue model for the NetCo is wholesale access fees per subscriber activated, plus potentially dark fiber leases and enterprise connectivity revenues. Because the cost of adding a new tenant onto an existing network is minimal, each additional ISP that joins the platform translates directly to higher margin — incremental revenue without proportional incremental cost.

This is why institutional investors are increasingly drawn to the model. Open-access fiber networks have gained significant momentum in the U.S. as a capital-efficient approach, with national wireless operators and infrastructure funds treating it as a path to infrastructure-style yields rather than traditional telecom returns.

If you’re evaluating whether to pursue this structure, it’s worth reading our earlier breakdown on the strategic differences between retail, wholesale, and open-access FTTH models first — the structural choice upstream determines everything about how revenue yield develops downstream.

How Multi-Tenant Networks Drive Higher Utilization

The utilization math shifts substantially when multiple ISPs compete on the same network. Here’s why.

In a single-operator retail model, the operator competes for a customer and either wins or loses. If the customer goes with a competitor on a different network, the operator’s infrastructure sits dark on that home.

In an open-access model, the outcome is different: if a competing ISP acquires that same customer over your network, the NetCo still earns a wholesale fee. The customer is monetized regardless of retail brand preference.

This structural shift transforms the competitive landscape from zero-sum to collaborative at the infrastructure level. More ISPs competing on the network means more customer acquisition activity — funded by the ISPs — which directly drives take-rate on the NetCo’s infrastructure.

UTOPIA Fiber in Utah is the clearest proof point in the U.S. market. The 20-city municipal consortium now hosts 15 competing ISPs across more than 100,000 households and has been operating profitably, with service options ranging from entry-level broadband to multi-gigabit tiers.

The competitive tension between ISPs drove both take-rate growth and pricing competitiveness — without the NetCo absorbing customer acquisition cost.

The European experience makes the same case at scale. Countries with mandated open-access frameworks have consistently achieved higher penetration rates. Spain, with one of the most competitive open-access environments in Europe, has reached a take-up rate above 90% — a figure that vertically integrated operators in less competitive markets struggle to approach.

Revenue Yield: The Case for Wholesale-Plus Models

FTTH open-access revenue layers: wholesale ISP fees, anchor tenant, enterprise leases, and dark fiber — revenue yield breakdown

Pure wholesale is one model. But the most financially attractive open-access structures for private operators are what practitioners are calling “wholesale-plus” — where the NetCo earns layered revenues across multiple streams.

Consider what a well-structured open-access network can monetize:

Tier 1 — ISP Wholesale Access Fees Per-subscriber fees from multiple retail ISPs. The more ISPs, the more diversified and resilient this revenue stream becomes. No single ISP departure collapses the revenue base.

Tier 2 — Anchor Tenant Commitments Large ISPs or carriers commit to a minimum take volume in exchange for preferred wholesale terms. This de-risks the early ramp period and supports the initial debt structure. The AT&T and BlackRock GigaPower joint venture uses this logic explicitly — anchor-tenant economics underwrite the build, with additional ISP tenants improving yield over time.

Tier 3 — Enterprise and Non-ISP Tenants Open-access infrastructure can be leased to enterprises, utilities, government agencies, and wireless carriers for backhaul. These are often high-margin, long-duration contracts that are completely uncorrelated to residential broadband churn. Ubiquity, one of the private-sector open-access operators, describes this as making networks “three-dimensional” — multiple uses and multiple providers across the same last-mile infrastructure.

Tier 4 — Dark Fiber Leases Carriers and enterprises willing to manage their own electronics can lease dark fiber strands, providing steady passive income with near-zero operational overhead for the NetCo.

This multi-tier revenue structure is why investor-backed NetCos are increasingly repricing their equity stories to infrastructure-style valuations — CPI-linked fees, long-life cash flows, and diversified revenue bases. It’s also why the model aligns well with growing ARPU strategies. For operators already pursuing ARPU optimization on a retail model, understanding how fiber broadband providers can grow revenue per user without increasing churn becomes directly applicable when transitioning toward wholesale structures.

What the Data Shows About Open-Access Network Performance

The global fiber market context matters here. The FTTH market was valued at $56 billion in 2024 and is projected to reach $110 billion by 2030, growing at 12.4% annually. In that growth environment, the competition for subscribers — and for capital — is intensifying rapidly.

The operators who position their networks as neutral infrastructure platforms will attract both ISP tenants and institutional capital more easily than those locked into a single retail brand. Infrastructure capital has a clear preference for diversified, long-duration revenue streams over concentrated retail broadband bets.

The European precedent backs this up at the market level. Countries with regulated open-access frameworks have generally achieved superior utilization, faster take-rate ramp, and stronger competitive pressure that benefits the underlying infrastructure economics.

Sweden’s Stokab (a wholesale-only dark fiber provider in Stockholm) has operated for over two decades as a model of how infrastructure separation creates both investment efficiency and market resilience.

In the U.S., where open-access is not mandated, the adoption is being driven by economics rather than regulation. The current interest rate environment — which pushed minimum FTTH build return requirements from roughly 8–10% in 2021 to 12–15% today — makes the diversified revenue logic of open-access even more compelling for investors who need infrastructure-level certainty.

Where Operators Get the Open-Access Model Wrong

Open-access FTTH economics only work when the execution matches the structure. The most common failure points:

Operational Standardization Is Non-Negotiable The speed at which ISPs can be onboarded — from order to revenue — is one of the defining operational metrics of a NetCo. Without standardized processes and automated provisioning, each new ISP becomes a custom integration project. That kills the scalability that makes the model work.

Anchor Tenant Selection Matters More Than You Think Starting with a weak or uncommitted anchor ISP leaves the NetCo exposed during the ramp period. The best-performing open-access networks enter the market with an anchor-tenant commitment that absorbs a meaningful floor of wholesale fees before the first additional ISP is onboarded.

Pricing Architecture Has to Be Transparent ISPs will only commit to an open-access network if they can model their margins with confidence. Opaque or discretionary wholesale pricing creates distrust and reduces the number of ISPs willing to compete on the platform.

Infrastructure Quality Drives Long-Term Retention The NetCo’s customer is the ISP, not the end-user. But end-user experience is the ISP’s primary SLA requirement. If network reliability, speed consistency, or provisioning quality degrades, ISPs churn off the platform. The infrastructure layer must be operated to enterprise standards.

Is Open-Access the Right Model for Your Network?

Not every fiber network benefits from the open-access structure. The model performs best when:

  • The serviceable market has competitive DSL or cable infrastructure that multiple ISPs can displace
  • Sufficient ISP demand exists — or can be cultivated — to populate the wholesale marketplace
  • The operator is willing to forgo retail brand equity in exchange for infrastructure yield
  • The capital structure allows for a longer ramp-up before multi-ISP revenues normalize

In markets where only one ISP is likely to ever operate on the network, the open-access structure adds complexity without meaningful revenue benefit. The model pays off when the platform genuinely attracts multiple tenants. That’s what converts underutilized fiber into a revenue-compounding infrastructure asset.

For executives evaluating the transition, the critical question isn’t whether open-access is theoretically superior — the economics generally support it in the right market conditions. The question is whether your current organization, operational stack, and capital structure are positioned to execute it well.

5 Frequently Asked Questions on Open-Access FTTH Economics

1. What is the main revenue difference between an open-access FTTH network and a traditional retail fiber model?

In a traditional retail model, the operator earns revenue only from the customers it directly acquires and retains. In an open-access model, the NetCo earns wholesale fees from every ISP tenant that activates subscribers on the network — regardless of which ISP wins the customer. This diversifies revenue and reduces dependence on any single retail take-rate.

2. Does open-access FTTH always require a regulatory mandate to be viable?

No. While open-access has historically been associated with regulated European markets, private operators and institutional investors in the U.S. are increasingly adopting it for purely economic reasons. The model reduces customer acquisition costs for the NetCo, diversifies revenue, and attracts infrastructure-style capital — independent of any regulatory requirement.

3. How does open-access affect network utilization specifically?

By allowing multiple ISPs to compete for subscribers over the same physical infrastructure, open-access aligns the competitive incentives of ISPs with the NetCo’s utilization goals. More ISPs mean more sales activity, more customer acquisition, and higher overall take-rate — without the NetCo absorbing the retail acquisition cost.

4. What are the biggest risks of transitioning to an open-access or wholesale model?

The primary risks are operational complexity (provisioning multiple ISPs requires standardized systems), anchor tenant dependency (early revenue depends heavily on a committed first ISP), and margin compression in wholesale pricing if the operator underprices access to attract tenants. Getting the wholesale pricing architecture right from the start is critical.

5. What financial metrics should executives track to evaluate open-access network performance?

The key metrics are: wholesale revenue per home passed (not just per subscriber), ISP tenant count and diversity, time-to-revenue per new ISP onboarded, network utilization rate across homes passed, and EBITDA margin by revenue tier. Infrastructure investors specifically focus on revenue durability and diversification — the number of ISP tenants and their combined revenue floor is as important as overall take-rate.

The Bottom Line

Open-access FTTH economics isn’t a theory — it’s a model that’s been stress-tested in some of the world’s most competitive fiber markets and is gaining serious traction with sophisticated capital. The core logic is straightforward: build the infrastructure once, open it to multiple service providers, and earn diversified revenue on every subscriber regardless of which retail brand wins the home.

For FTTH executives navigating a market where build costs are rising, return hurdles are tightening, and competition is intensifying, the utilization and revenue yield advantages of open-access deserve serious strategic consideration.

Ready to evaluate whether an open-access model fits your network and market? Contact us to discuss how the right content strategy can position your organization at the forefront of this shift.

How to Structure FTTH ISP Partnerships on Open-Access Networks

Open Access Provider partnership with  Internet Service Provider (ISP)

Most FTTH operators who move into open-access territory spend months negotiating fiber capacity agreements, only to realize 12 months in that the economics don’t work — not because the market is wrong, but because the partnership architecture was wrong from day one.

Structuring FTTH ISP partnerships on open-access networks is less about technology and more about governance, incentives, and commercial alignment.

Get those three right, and you create a platform that scales. Get them wrong, and you end up with under-utilized infrastructure, frustrated ISP partners, and a pipeline of unresolved disputes.

This guide breaks down exactly how to structure these partnerships — the commercial models, the contractual essentials, the SLA frameworks, and the performance levers that separate high-performing open-access networks from expensive infrastructure experiments.

Why Open-Access Models Are Forcing a New Partnership Playbook

Open-access FTTH isn’t new — but the competitive pressure to execute it well is intensifying fast. The global fiber-to-the-home market is projected to reach USD 25.1 billion by 2030, growing at a CAGR of over 10% (source: Grand View Research). That growth is being driven, in large part, by open-access mandates and wholesale models that require network operators to serve multiple ISPs on a single passive infrastructure layer.

The upside is real: open-access networks spread CapEx across multiple revenue streams, attract ISP partners with differentiated service packages, and future-proof infrastructure investment. But the model introduces complexity that pure retail operators simply don’t face.

When you’re serving three, five, or ten ISPs on the same fiber plant, every structural decision — from how you price capacity to how you define “acceptable latency” in an SLA — becomes a negotiation point. And if your partnership agreements aren’t built for that complexity, the operational drag will eat your margins.

The Three Commercial Models for FTTH ISP Partnerships

Before drafting any agreement, you need to decide which commercial model governs the partnership. Each carries different risk profiles, revenue mechanics, and operational requirements.

FTTH ISP Partnership Commercial Models

1. Bitstream Access

You own the active network and sell ISPs a managed broadband service at a defined speed tier. The ISP doesn’t manage the access layer — they just resell to end-users. This is the simplest entry point for ISP partners, but it limits their differentiation and your revenue ceiling.

Best for: Smaller ISP partners or new market entrants who want speed-to-market without infrastructure complexity.

2. Layer 2 Wholesale (VLAN-based)

ISPs connect at the Ethernet layer, run their own IP routing and services, and you provide the physical and data-link connectivity. This is the dominant model across European open-access markets — the Dutch, Swedish, and Australian NBN frameworks all lean on Layer 2 variants.

Best for: ISPs with technical capability who want full control over their customer experience.

3. Dark Fiber or Duct Access

You lease passive infrastructure — fiber strands or physical ducts — and the ISP builds everything above the physical layer. Maximum flexibility for the ISP, minimal operational burden for you, but lower recurring revenue per port.

Best for: Large telcos and alternative network operators (altnets) who want to run their own active equipment.

Understanding which model (or which combination) fits your ISP partner mix is the first decision that shapes everything downstream — from pricing schedules to NOC escalation workflows. If you’re still deciding between a full open-access model and a hybrid retail approach, this breakdown of retail vs wholesale vs open-access FTTH models is worth reading before you finalize your commercial framework.

Contractual Essentials: What Every FTTH ISP Partnership Agreement Needs

A signed ISP partner agreement that’s missing key provisions isn’t a contract — it’s a liability. These are the non-negotiable elements every open-access ISP agreement should include.

Network Access Terms Define the points of interconnection (PoI), handover specifications, and what happens when infrastructure changes. ISPs need certainty that the physical and logical access points they build their network around won’t shift without adequate notice.

Capacity and Port Commitment Specify minimum port reservations, maximum contention ratios, and the process for scaling. Ambiguity here creates disputes the moment an ISP’s traffic grows faster than expected.

Service Level Agreements (SLAs) This deserves its own section — and it gets one below. For now: every metric in an SLA needs an agreed measurement methodology, not just a target number.

Revenue and Billing Structure Monthly recurring charges, activation fees, provisioning timelines, and payment terms should be explicit. Include a mechanism for price reviews — quarterly indexing or annual renegotiation clauses prevent the resentment that builds when costs drift without a formal process.

Dispute Resolution Define a tiered escalation process: operational escalation first, commercial escalation second, formal mediation third. Most disputes get resolved at level one if the process is clear upfront.

Termination Provisions Include minimum commitment periods, early termination fees, and a clear process for decommissioning ports. ISPs that exit abruptly without a structured offboarding process create operational chaos.

Designing SLAs That Actually Hold Up Under Pressure

FTTH ISP partnership SLA dashboard showing network availability metrics, fault categories, and credit tracking for open-access networks

SLAs in FTTH ISP partnerships fail for one reason more than any other: they’re written for the best case, not the real operating environment.

A robust open-access SLA framework has four components:

1. Availability Targets (by segment) Don’t set a single network availability target. Separate backbone availability, access network availability, and PoI uptime — each has different failure modes and recovery timelines. A 99.9% target means nothing if it’s averaged across segments with wildly different risk profiles.

2. Mean Time to Repair (MTTR) by fault category Categorize faults by severity (P1 through P4) and assign MTTR commitments to each. A fiber cut affecting 500 homes is not the same as a single-ONT provisioning failure. Your ISP partners need to know which problems get the all-hands response and which go into the normal queue.

3. Measurement and Reporting ISPs should have real-time visibility into network performance data — not monthly PDF reports. Consider a partner portal with live dashboards showing port status, fault tickets, and SLA credit accruals. Transparency reduces disputes before they start.

4. Credit Mechanisms SLA credits need to be automatic, transparent, and proportional. If an ISP has to fight for credits every time you miss a target, the relationship degrades fast. Build the credit calculation into your billing system and apply it without requiring a formal claim.

Revenue Models That Align Incentives on Both Sides

The commercial tension in most FTTH ISP partnerships comes from misaligned incentives. The network operator wants high port utilization and predictable recurring revenue. The ISP wants low fixed costs and flexibility to scale or contract based on market conditions.

Here’s how to structure revenue models that work for both:

Port-Based Flat Fee + Usage Uplift Charge a fixed monthly fee per provisioned port, with a variable uplift for traffic above a defined threshold. ISPs can forecast their fixed costs; you capture upside as their customer base grows.

Take-or-Pay Commitments Require ISP partners to commit to a minimum port volume — typically 60-70% of their contracted capacity — regardless of actual utilization. This protects your revenue floor while giving ISPs room to manage seasonal demand fluctuations.

Tiered Pricing by Speed Tier Price access differently for 100Mbps, 500Mbps, and 1Gbps service tiers. This gives ISPs flexibility to differentiate their product portfolios while creating a natural revenue escalation path as end-users upgrade.

Revenue Sharing on Value-Added Services If you’re enabling ISP partners to offer managed Wi-Fi, smart home services, or B2B connectivity products over your infrastructure, consider a revenue-share arrangement on those incremental services. It creates shared upside and deepens the partnership beyond a pure capacity transaction.

The goal is a model where your ISP partners succeed when your network is performing — because their growth directly drives your revenue. For operators focused on maximizing revenue per subscriber, the strategies in how fiber broadband providers can grow ARPU without increasing churn apply directly to how you structure your ISP partner tiers.

According to FTTH Council Europe’s 2024 market analysis, open-access networks in markets with structured ISP partnership frameworks show 15-22% higher port utilization rates compared to networks with informal or underdefined commercial arrangements. The structure itself drives performance. (Source: FTTH Council Europe)

Governance: The Part Most Operators Underinvest In

You can have a perfect commercial model and a robust SLA framework — and still watch the partnership deteriorate if governance is weak.

Governance in FTTH ISP partnerships means establishing formal mechanisms for ongoing decision-making, conflict resolution, and strategic alignment. At minimum, structure this:

Operational Review Cadence Monthly operational reviews between NOC teams and ISP technical counterparts. Agenda: open faults, SLA performance, upcoming maintenance windows, provisioning backlog.

Commercial Review Cadence Quarterly reviews at the commercial/VP level. Agenda: revenue performance, pricing review triggers, ISP growth plans, capacity forecasting.

Strategic Partnership Reviews Annual reviews at the C-suite level. Agenda: network roadmap alignment, new service opportunities, contract renewal discussions, market expansion.

Escalation Contacts Every ISP partner should have a named relationship manager on your side — not a general support queue. When something goes wrong at 2am on a Saturday, the ISP’s NOC should know exactly who to call.

Governance isn’t bureaucracy — it’s the infrastructure that keeps commercial relationships functional as they scale.

5 Most Common Mistakes in FTTH ISP Partnership Structures

5 Most Common Mistakes in FTTH ISP Partnership Structures

1. One-size-fits-all SLAs Different ISPs have different customer bases, technical capabilities, and risk tolerances. A startup ISP serving residential customers doesn’t need the same SLA as an enterprise-focused provider running mission-critical services.

2. Underspecified PoI requirements Leaving interconnection specifications vague creates expensive rework when the ISP’s equipment doesn’t match your handover assumptions.

3. No capacity planning mechanism ISP growth is rarely linear. If there’s no formal process for ISPs to signal capacity requirements 6-12 months ahead, you’ll end up with provisioning bottlenecks at exactly the wrong time.

4. Manual billing with no audit trail Open-access billing is complex. Automate it from day one and maintain a transparent audit trail that ISP partners can access. Manual processes break down as partner count grows.

5. Skipping the exit provisions Operators avoid drafting termination clauses because they don’t want to signal doubt in the relationship. Don’t skip this. Clear exit provisions actually reduce conflict when a partnership ends — and some of them will.

FAQ: FTTH ISP Partnerships on Open-Access Networks

What’s the minimum contractual term that makes sense for an ISP partnership on an open-access network? 

Most operators find that 3-year initial terms with annual renewal options strike the right balance — long enough for the ISP to justify their own infrastructure investment, short enough to remain commercially flexible. Anything under 12 months rarely justifies the onboarding cost.

How do you handle ISP partners who consistently underutilize committed capacity? 

Start with a commercial conversation, not a contractual one. Underutilization often signals a market development issue the ISP is struggling with — and if you can help them grow their subscriber base, everyone wins. If it’s a structural mismatch, invoke the take-or-pay clause and use the renegotiation window to right-size the commitment.

Can a network operator serve both retail customers and ISP wholesale partners on the same infrastructure without conflict of interest? 

Yes, but it requires structural separation — at minimum, a separate commercial team managing the wholesale channel and a clear policy preventing the retail arm from accessing ISP partner commercial data. Some operators go further with legal separation. Transparency is the key variable.

What’s the most effective way to onboard a new ISP partner technically? 

Run a structured technical readiness assessment before signing. This covers the ISP’s equipment specifications, NOC capabilities, IP addressing plan, and provisioning workflow. Catching technical mismatches pre-launch is far cheaper than fixing them post-launch under SLA pressure.

How should SLA credits be structured to avoid abuse or gaming by ISP partners? 

Tie credits to measurable, system-generated metrics — not self-reported ISP claims. Define the measurement window (rolling 30 days vs. calendar month), the credit calculation formula, and the maximum credit cap per incident. A well-defined credit framework eliminates the ambiguity that makes gaming possible.

Structure First, Scale Second

The operators who build high-performing open-access ISP partnership programs aren’t necessarily the ones with the best technology — they’re the ones who invested in the right structure before the first ISP contract was signed.

Commercial model clarity, SLA rigor, governance discipline, and revenue alignment aren’t overhead. They’re the foundation that makes everything else scalable.

If you’re building or rebuilding your FTTH ISP partnership framework, start with the commercial model, nail the SLA design, and build your governance cadence before you focus on the pitch to new partners. The partnerships that perform are the ones that were structured to perform from day one.

Ready to build an FTTH content strategy that positions your brand as the authority in this space? Connect with TheWriter.id to explore how specialized FTTH ghostwriting can accelerate your thought leadership.

How Fiber Broadband Providers Can Grow ARPU Without Increasing Churn

ARPU in the FTTH industry

Here’s the uncomfortable truth: most fiber broadband providers have built world-class infrastructure and then handed customers world-class pricing leverage right along with it.

Subscribers know what gigabit costs down the street. They’ve read the comparison sites. They’ll threaten to churn — and sometimes follow through — the moment you nudge prices upward. So your finance team wants fiber ARPU growth, and your CX team wants churn contained. And somewhere in the middle, your strategy team is trying to figure out how to satisfy both.

The good news? Growing ARPU and controlling churn are not mutually exclusive. They only feel that way when you’re using blunt instruments — price hikes on commodity tiers — instead of precision tools. The operators scaling ARPU most effectively in 2025 are doing it by delivering more value, not just charging more for the same pipe.

Let’s break down exactly how they’re doing it.

Why Treating ARPU and Churn as Enemies Is the Wrong Mental Model

The instinct to raise prices on your base tier feels logical — you’ve deployed expensive infrastructure, and you need returns. But in a competitive fiber market, undifferentiated price increases are a fast-track to customer dissatisfaction.

According to Omdia’s 2024 Fixed Broadband Operator Report, operators that increase revenue primarily through price hikes on base plans see churn rates spike an average of 1.8 percentage points in the 90 days following the increase. That’s revenue given with one hand and taken back with the other.

The operators growing ARPU sustainably — think Openreach’s wholesale ARPU trajectory, or Comcast’s broadband ARPU sitting above $65/month despite intense cable competition — are doing so through value perception, not price coercion.

Customers pay more when they believe they’re getting more. That’s the mental model shift that changes everything.

The 5 Proven Levers for Fiber ARPU Growth

1. Tiered Speed Architecture That Maps to Real Household Behavior

Most FTTH providers offer three tiers and call it a day. But the operators driving the best ARPU outcomes are engineering tier structures around actual household use cases — not just Mbps numbers.

Think: a “Work From Home Power” tier with SLA-backed uptime and priority QoS. A “Gamer & Streamer” tier with low-latency guarantees and 4K multi-stream headroom. A “Connected Home” tier bundled with mesh Wi-Fi equipment included.

Analysys Mason’s broadband pricing research shows that operators using use-case framed tiers achieve 22–31% higher uptake on mid and premium tiers versus those using speed-only positioning. The customer isn’t buying 500 Mbps — they’re buying the ability to work, stream, and game without arguments in the house. That’s a story worth more money.

2. Value-Added Services (VAS) That Turn Your Network Into a Platform

Value-added services iceberg showing hidden fiber ARPU growth opportunities beyond basic broadband connectivity

The single biggest ARPU growth opportunity most FTTH operators are underexploiting is the app and service layer above the pipe. Your fiber network is already inside the home — that’s an extraordinary distribution advantage if you use it.

High-performing VAS categories for FTTH providers include:

  • Managed Wi-Fi & Home Network Security — chargeable at $5–12/month, with cloud-managed security platforms like Calix Revenue EDGE delivering measurable churn reduction alongside ARPU lift
  • Smart Home Integration — energy management, smart lighting, and home automation tie-ins
  • Cloud Backup & Storage — particularly compelling for SME-adjacent residential subscribers
  • Premium OTT Bundles — co-branded Netflix, Disney+, or regional streaming packages that you can negotiate wholesale and retail with margin

IDATE DigiWorld’s 2024 FTTH Revenue Report found that operators with three or more active VAS offerings per subscriber base achieved average ARPU premiums of $8–14/month over operators running connectivity-only models. That’s real money at scale.

3. Bundle Architecture That Creates Switching Costs Without Feeling Like a Trap

Bundling works — but only when it’s engineered around customer utility, not operator convenience. Customers who are bundled because it’s genuinely easier and cheaper for them have dramatically lower churn propensity than customers who are bundled because they got confused during the sign-up flow.

The framework that works: anchor on the fiber connection, then build utility outward.

  • Fiber + Managed Wi-Fi + Security = the “Safe & Fast Home” bundle
  • Fiber + OTT Entertainment + Smart TV box = the “Entertainment Hub” bundle
  • Fiber + VoIP + Business-Grade SLA = the “Work From Home Pro” bundle

Analysys Mason research on multi-play bundling consistently shows that customers on two-service bundles churn at 40–50% lower rates than single-play broadband subscribers. Three-service customers lower still.

Bundle your way to ARPU growth — but build bundles people want to stay in.

4. SME and SOHO Upsell Within Your Residential Footprint

This is one of the most underrated fiber ARPU growth plays in the market today. In virtually every FTTH deployment area, a meaningful percentage of your “residential” subscribers are actually running home-based businesses, freelancers, or micro-enterprises.

These subscribers have enterprise-grade needs with residential pricing. That’s a gap you can close profitably:

  • Offer a “Business Essentials” residential-plus tier with static IPs, uptime SLAs, and priority support
  • Position it as a professional-grade service — not just a faster pipe
  • Price it at a 30–50% premium over top residential tier

Ofcom’s Connected Nations 2024 report noted that over 28% of UK residential broadband users conduct regular paid work or business activities from home. That’s nearly a third of your base with potential willingness-to-pay for business-grade features. Most operators leave this on the table entirely.

5. Loyalty and Tenure-Based Upgrade Pathways

Fiber broadband loyalty program timeline showing ARPU growth milestones at 12, 24, and 36 months with declining churn risk

Counterintuitive but powerful: your longest-tenured customers are often your most price-insensitive — provided you acknowledge their loyalty proactively rather than taking it for granted.

Best-practice operators are running “Loyalty Upgrade” programs that work like this:

  1. At 12-month mark: proactive outreach with a free speed tier upgrade or VAS trial
  2. At 24-month mark: exclusive pricing on a premium bundle not available to new subscribers
  3. At 36-month mark: “Founding Customer” status with locked-in pricing and priority support

This is the opposite of the standard telco playbook (best deals go to new customers, loyalty gets punished). And it works: Bain & Company’s telecom loyalty research shows that a 5% improvement in customer retention in broadband translates to 25–95% improvement in profitability over a customer lifetime.

Tenure-based ARPU growth isn’t just feel-good — it’s the highest ROI retention play available.

What High-Churn Operators Get Wrong About Pricing

If you’re seeing churn accelerate every time you touch pricing, it’s almost always one of three root causes:

1. Price increases without value narrative. Subscribers got a rate hike letter with no explanation of what improved. Fix: always communicate what changed — new infrastructure investment, speed upgrades, security enhancements.

2. New customer pricing is visibly better than existing customer pricing. This is the fastest way to weaponize your own subscriber base against you. Price parity or tenure discounts are non-negotiable in competitive markets.

3. ARPU optimization is happening at the wrong point in the customer lifecycle. Upsell attempts at month 2 (before trust is established) underperform dramatically versus attempts at month 6–12. Time your revenue expansion motions to lifecycle stage.

Building Your Fiber ARPU Growth Roadmap: Where to Start

Achieving fiber ARPU growth

If you’re looking to action this in Q3/Q4, here’s a sequenced approach:

  1. Audit your current tier architecture — are tiers differentiated by use case or just speed?
  2. Survey your base for VAS interest — a simple NPS follow-up question (“What would make your service worth 20% more?”) generates invaluable intelligence
  3. Identify your SOHO/SME segment within residential — this often requires nothing more than usage pattern analysis
  4. Design a loyalty program structure — even a basic tenure-based upgrade pathway moves the needle
  5. Test one bundle and measure — pick your highest-potential segment and run a 90-day bundle pilot before full rollout

Fiber ARPU growth is not a single lever — it’s a system. And the operators building that system deliberately are the ones separating themselves from the pack.

Frequently Asked Questions (FAQ)

What is a realistic fiber ARPU growth target for an established FTTH operator?

Best-in-class FTTH operators are targeting 3–7% annual ARPU growth through a combination of tier upgrades, VAS attachment, and bundling — without price increases on base tiers. Markets with strong SME upsell potential may see higher trajectories. The key is measuring ARPU growth per customer cohort, not just blended average, to understand which segments are driving or dragging performance.

How do you grow ARPU without triggering churn in price-sensitive segments?

The answer is value-led growth, not price-led growth. Introduce optional upgrades and VAS add-ons rather than mandatory base price increases. Ensure that every pricing communication is framed around what the customer gains.

For the most price-sensitive segments, consider usage-based upsells (“you’re regularly hitting your speed tier ceiling — here’s an upgrade”) which frame the upsell as a customer insight, not a sales pitch.

Which value-added services deliver the best ARPU lift for FTTH operators?

Based on operator deployment data, managed Wi-Fi and home network security consistently deliver the best combination of attachment rate and ARPU premium (typically $6–10/month per subscriber). OTT bundle partnerships and smart home integrations follow.

The optimal VAS mix varies by market demographics and competitive context — operators in markets with high smart home adoption see stronger results from connected home services than those in less tech-savvy segments.

What’s the relationship between bundle depth and churn reduction?

Research consistently shows that each additional service added to a bundle reduces monthly churn probability by 30–50%. A triple-play fiber subscriber (broadband + managed Wi-Fi + security, for example) is dramatically stickier than a standalone broadband subscriber. The mechanism is switching cost — not in the punitive sense, but in the genuine inconvenience of having to replicate an integrated service stack elsewhere.

How should FTTH operators approach ARPU growth in markets with heavy price competition?

In hyper-competitive markets, ARPU growth strategy needs to focus almost entirely on the service layer rather than connectivity pricing. This means aggressive VAS development, differentiated business-tier offerings for SOHO/SME customers, and loyalty programs that reward tenure.

Competing on connectivity price in a commodity broadband market is a race to the bottom — competing on the service experience above the pipe is where sustainable margin lives.

The Bottom Line: ARPU Growth Is a Strategy, Not a Price Decision

The operators that will win the next five years of FTTH competition aren’t the ones who find creative ways to charge more for the same service. They’re the ones who build genuine service ecosystems that make the idea of switching feel like a significant downgrade.

Fiber ARPU growth done right is invisible to the customer — they’re just getting more value and paying a fair price for it. That’s the difference between churn-safe revenue expansion and a subscriber revolt waiting to happen.

Start with your tier architecture. Add one VAS. Build your loyalty pathway. Then measure, iterate, and scale. The infrastructure is already in the ground — now it’s time to make it work harder commercially.

Ready to develop your ARPU growth strategy? Connect with FTTH thought leaders and operators on LinkedIn who are sharing real-world implementation insights from deployments across Southeast Asia, Europe, and North America.

FTTH Overbuild Strategy — And the Five Moves That Win

Overbuild homepass in the FTTH industry

Most fiber executives facing a second competitor in their market make the same three moves: sharpen the pricing pencil, launch a brand campaign, and announce a new speed tier. Within eighteen months, margins are compressed, churn is roughly unchanged, and the competitor is still there.

Overbuilding is not a temporary disruption that resolves itself. It is the permanent competitive state of any mature fiber market — and the strategies built for greenfield expansion do not work once a second fiber strand runs down your street.

FTTH growth strategies in overbuilt markets require a fundamentally different playbook, and the operators learning that lesson late are already paying for it.

The Overbuild Reality Check

The numbers have moved fast. In 2022, roughly 4% of U.S. homes had access to two or more FTTH providers. By the end of 2023, that figure had nearly doubled to 7.2%. With fiber now passing over 98 million U.S. homes and 84% of potential secondary and tertiary passings still untapped, the competitive pressure has only one direction to go.

The math is compounding. Nearly 60% of remaining attractive build opportunity sits in markets with over 50% existing fiber coverage — meaning new entrants are increasingly chasing adjacencies to already-served territory, not whitespace. Build costs have risen approximately 6% annually. Return minimums have climbed from 8–10% in 2021 to 12–15% today. The operators who can still make the economics work are those with the structural advantages to justify the risk — not those hoping the second fiber provider will eventually retreat.

Here is the reframe that matters: overbuild is not a price problem or a marketing problem. It is a business model problem. The operators who treat it as the former will fight the wrong battle. Those who treat it as the latter will use the pressure to build something their competitor cannot easily replicate.

Why the Standard Overbuild Playbook Fails

Speed and pricing competition

Before examining what works, it is worth being direct about what does not — because the conventional responses are not just ineffective, they actively accelerate the margin erosion they are meant to prevent.

The Race-to-the-Bottom Pricing Trap

The instinct to drop prices when a competitor enters is understandable. It is also wrong in most cases.

A 15% price reduction in a market with a 45% take rate and a $65 ARPU does not win back meaningful share — it simply costs you $9.75 per month on every customer you already have. The subscribers most likely to switch for price alone are also the subscribers with the lowest lifetime value and the highest propensity to churn again when the next promotion appears. You are competing for the wrong customers at the worst possible unit economics.

Price wars have a predictable winner: the operator with the deeper balance sheet. In a market where a well-capitalized overbuilder is entering, the incumbent rarely holds that advantage. The correct response is to make price a less decisive factor — not to race toward the floor.

The Speed Arms Race Nobody Asked For

Gigabit is now table stakes. Symmetrical 10Gbps is a compelling engineering achievement. It is not a customer acquisition strategy.

Residential broadband usage patterns have not changed in ways that make symmetrical multi-gig service a meaningful differentiator for the overwhelming majority of households. Bandwidth demand is growing at roughly 20% annually, driven by streaming, remote work, and smart home devices — applications that are well served by today’s gigabit tiers. Investing heavily in speed differentiation solves a problem your customers do not have, while leaving unaddressed the problems they actually do have: installation friction, service reliability, and support quality.

Technical differentiation in residential fiber is largely illusory. Both operators have fiber. Both have low latency. Competing on a dimension where the gap is invisible to the customer is not a strategy — it is a capital misallocation.

The Marketing Spend Spiral

The reflex to increase brand spend when a competitor enters is understandable and nearly always counterproductive. Marketing can accelerate a structural advantage. It cannot manufacture one that does not exist.

In overbuilt markets, both operators typically increase customer acquisition spend simultaneously. The result is symmetric cost inflation with no net share gain — CAC rises for both, conversion rates fall for both, and the only winners are media buyers. The root problem is structural, not perceptual. No campaign budget resolves a situation where two identical-looking services compete on identical terrain.

The Five FTTH Strategies That Actually Work

The Five FTTH Strategies That Actually Work

The operators growing in overbuilt markets share a common characteristic: they stopped competing on the dimensions where competition is most intense and started winning on dimensions their competitor had not prioritized.

1. Win the Vertical Segments Your Competitor Ignores

Mass-market residential broadband is where the overbuild battle is loudest and margins are thinnest. It is also where your competitor is most focused. The structural opportunity lies in the segments they are ignoring.

Small and medium businesses in fiber-served markets are chronically underserved by residential-grade products but underserved by enterprise pricing and complexity. Multi-dwelling units represent density that dramatically improves per-passing economics, but most overbuilders approach MDU relationships as an afterthought. Anchor institutions — schools, healthcare facilities, municipal buildings — provide long-term contracted revenue that is structurally immune to consumer churn dynamics.

The strategic exercise is identifying the two or three verticals where your network architecture provides a genuine structural advantage over the competitor — whether that is existing conduit access, existing MDU relationships, or technical capability in enterprise-grade service delivery. Pricing power lives in specialization. A fiber provider that owns the SMB segment in a market commands ARPU that mass-market competition cannot touch.

2. Turn Churn Defense Into a Revenue Strategy

Retention spending is typically treated as a cost center. In overbuilt markets, it is the highest-ROI activity available.

The operators growing ARPU in competitive markets are not doing so through new subscriber acquisition — they are doing so through proactive upgrade programs that move existing customers up the value stack before a competitor’s promotional offer becomes the trigger for defection. A customer on a managed Wi-Fi package with a proactive monitoring service is not the same customer as a subscriber on a basic gigabit plan, regardless of how similar the underlying infrastructure is.

The metric that should anchor your competitive analysis is not take rate — it is monthly revenue per passing. Take rate tells you how many homes you are serving. Revenue per passing tells you how much value you are extracting from the market, regardless of what the competitor is doing with the other homes. Operators who optimize for this metric consistently outperform those optimizing for subscriber count.

The practical implication: every retained customer is an upgrade opportunity. Build a retention motion that leads with value addition before the churn signal appears.

3. Weaponize Your Install and Service Experience

In a two-fiber market, the activation experience is often the deciding factor — not because customers research it in advance, but because first-mover advantage in a household compounds over years. The operator who completes a frictionless installation first, with professional equipment placement and a working managed Wi-Fi setup, creates inertia that a competitor’s promotion must overcome.

Service quality as a competitive moat is not theoretical. It is measurable. A 20-point NPS gap between two fiber providers in the same market translates into meaningfully different churn rates, meaningfully different word-of-mouth acquisition, and meaningfully different win rates when the competitor’s promotional pricing expires.

The specific elements that matter: installation scheduling reliability (not just speed), proactive outage communication before the customer notices an issue, and enterprise-grade support tiers for the business customer segments described above. These are operational investments that do not show up in a speed test but determine whether a customer stays for two years or ten.

4. Restructure Partnerships Before Your Competitor Does

The most durable competitive positions in overbuilt markets are not won through customer acquisition — they are won through structural agreements that make competitive entry more difficult or less attractive.

MDU access agreements with exclusivity provisions, long-term municipal right-of-way arrangements, and anchor tenant contracts that provide revenue floor certainty are all assets that reduce competitive exposure at the network level rather than the customer level. An overbuilder calculating the ROI of entering a market does that math on available homes. A market where 30% of MDU density is locked into long-term agreements with an existing operator looks materially different than one without those agreements.

Long-term wholesale arrangements serve a similar function. A competitor that can access your network on commercial terms to serve their own retail customers has less financial incentive to build parallel infrastructure. Network utilization floors protect your economics regardless of what happens at the retail level.

The partnership conversation is time-sensitive. These agreements are far easier to structure before a competitor arrives than after. The operator who moves first on MDU relationships, municipal agreements, and wholesale terms owns the structural advantage for years.

5. Use M&A and Network Sharing to Change the Competitive Math

In mature overbuilt markets, consolidation is not a risk to be managed — it is the likely outcome. The question is whether you position yourself as the consolidator or the consolidated.

Network sharing agreements — both active (sharing active equipment) and passive (sharing conduit, poles, and duct) — offer a path to margin recovery that does not depend on subscriber growth. Two operators running parallel fiber builds through the same geography is economically inefficient for both. Passive infrastructure sharing reduces per-unit build costs and can restore project-level economics that rising interest rates and build cost inflation have made marginal.

The M&A decision framework is portfolio-based, not market-by-market. In markets where you have structural advantages — strong MDU penetration, institutional relationships, low churn — the right answer is often to acquire the overbuilder rather than compete indefinitely. In markets where the competitive position is weak and structural improvement is unlikely, an orderly exit at a reasonable valuation is preferable to years of margin compression followed by a distressed exit.

The operators who will be in the strongest positions in 2028 are the ones making these portfolio decisions now, while optionality is still available.

The Mindset Shift: From Network Operator to Market Owner

The Mindset Shift: From Network Operator to Market Owner

Every strategy above has a common thread: it is easier to execute if you think of yourself as owning a market rather than operating a network in one.

A network operator’s competitive frame is: how do we protect our subscriber base? A market owner’s competitive frame is: what would it take for this market to be structurally uneconomic for a second fiber provider?

Market ownership looks different operationally. It means building relationships with local government before you need permits, not when you do. It means being the fiber provider that economic development officials call when businesses are evaluating location decisions. It means being visible in community institutions in ways that make your brand synonymous with the market’s connectivity future — not just another ISP.

This positioning is not marketing spend. It is relationship capital built over years of showing up as a community infrastructure partner rather than a subscription service. And it is nearly impossible for a competitor to replicate quickly, regardless of how much they are willing to spend on customer acquisition.

Building FTTH Overbuild Strategy Playbook

FTTH Overbuild Strategy

The five strategies above are not sequential — they are simultaneous. But the practical starting point is an honest audit of your current position across each dimension.

For each strategy, answer one diagnostic question:

  • Vertical segments: Do you have a defined go-to-market for SMB, MDU, or institutional customers that is separate from your residential motion — with dedicated pricing, products, and sales capacity?
  • Churn defense: Do you have a proactive upgrade program that touches customers before a competitor does, or is your retention motion reactive?
  • Service experience: Do you track NPS by cohort, and do you know how your score compares to the competitor’s?
  • Partnerships: Have you reviewed your MDU and municipal agreements in the past twelve months, and do you know which relationships are at risk of competitor approaches?
  • M&A / network sharing: Does your leadership team have a clear view of which markets in your portfolio are worth defending, and which would be better consolidated or exited?

If you cannot answer these questions with specificity, that is the starting point. A 90-day sprint to assess, decide, and assign ownership across these five dimensions costs almost nothing compared to the alternative: competing on price and speed until the economics force a decision that is no longer yours to make.

The one question every FTTH executive should be able to answer before a competitor arrives in their market: “Why would a customer choose us if price were identical?”

If the honest answer is “they wouldn’t,” the work starts now.

FAQ: What FTTH Executives Are Asking Right Now

Does BEAD funding make overbuild worse or better for established operators?

For established urban and dense suburban operators, BEAD is largely separate from the competitive dynamics you are managing today. BEAD targets underserved and unserved areas — the overbuild risk is concentrated in dense suburban adjacencies where multiple operators are chasing the same remaining attractive build opportunity, not in BEAD-eligible rural markets.

Where BEAD does affect established operators is on the supply chain side. BEAD construction timelines converging with AI data center fiber demand in 2026 is creating real fiber supply constraints. Operators planning major builds should be securing supply contracts now rather than assuming availability on standard lead times.

Our take rates are around 40–45%. Is that acceptable in a competitive market?

Industry data from the Fiber Broadband Association’s December 2025 survey puts average primary market take rates at 46.5%. Interestingly, in markets where a secondary fiber provider enters, combined take rates typically rise to approximately 61% — suggesting that competition expands the addressable subscriber pool rather than simply dividing an existing one.

The more important metric is monthly revenue per passing, not raw take rate. A 40% take rate with strong SMB penetration and managed services ARPU can be significantly more valuable than a 55% take rate on commodity residential broadband. Do not optimize for the metric that looks best; optimize for the one that drives long-term business value.

How does the AI and data center boom affect our FTTH strategy?

Two ways, and they are both significant. First, AI infrastructure is competing with FTTH for the same fiber supply. Corning has reported 58% year-over-year enterprise sales growth driven by AI network demand, and AI-focused data centers require dramatically more fiber per rack than traditional infrastructure.

Operators planning capital programs should factor supply constraints and rising costs into their build schedules.

Second, the AI boom is driving demand for high-capacity enterprise-edge connectivity — a direct revenue opportunity for FTTH operators with the right network architecture and enterprise go-to-market capability.

The businesses that need AI-capable connectivity are often in the same markets as your existing residential network. This is a meaningful ARPU expansion opportunity if you build the product and sales motion to capture it.

Should we be considering open-access network models to survive overbuild?

Open-access is gaining real traction in the U.S. after demonstrating its viability in Europe, and it is worth serious evaluation — but it is not a universal answer. The model makes the most sense for operators who want to maximize infrastructure utilization and reduce risk by monetizing the network layer, accepting lower retail margins in exchange for higher network-level returns and reduced churn exposure.

The trade-off is retail margin and customer relationship control. If your competitive strategy depends on owning the customer experience — managed services, enterprise relationships, community positioning — open access may undermine the differentiation you are trying to build. The decision should follow your strategic positioning, not precede it.

With build costs up ~6% annually and return minimums now at 12–15%, when does a new build stop making sense?

The economics have tightened materially since 2021, when the same return minimums sat at 8–10%. The restoration of 100% bonus depreciation in federal tax law for 2026 provides a meaningful one-time capex offset — analysts estimate this could fuel a 5–15% increase in FTTH capex spending — but it does not structurally change the underlying project economics.

The practical decision rule: build only where you can credibly own the market long-term. A new build into a market where you will be the second fiber provider requires a clear answer to why you will win the structural position over time, not just whether the initial take rate assumptions pencil out.

If you cannot articulate a path to market ownership, the capital is better deployed defending and expanding the markets where you already have structural advantages.

Is fixed wireless access (FWA) a real competitive threat to FTTH in overbuilt markets?

Yes, in specific segments — and underestimating it is a mistake. FWA competes most effectively in the 100–300 Mbps residential tier at aggressive promotional price points, which is precisely the tier being commoditized in overbuilt fiber markets.

For price-sensitive subscribers who do not require symmetrical speeds, multi-device density, or the latency performance that fiber delivers, FWA is a credible alternative.

The structural answer remains fiber’s advantage on latency, symmetry, reliability, and capacity for households with five or more connected devices.

FWA is a real threat in the price-sensitive residential segment, not in enterprise, MDU, or high-usage residential — which is another argument for moving your mix toward the segments where FWA cannot credibly compete.

Conclusion: Overbuild Is a Filter, Not a Ceiling

The FTTH markets that will matter in 2028 and 2030 are being shaped by decisions made today — before consolidation forces the issue, before partner agreements are locked up by competitors, and before the operators with the weakest strategic positions have exhausted their options.

Overbuilt markets do not eliminate growth. They filter for operators with the business model discipline, structural positioning, and strategic clarity to earn it.

The playbook above is not about surviving overbuild. It is about using the pressure to build something more durable than what existed before the competitor arrived.

Audit your position across the five strategies this quarter. Identify the one where the gap is largest and the opportunity is most immediate. Start there.

The market will consolidate around the operators who moved first. Make sure you are one of them.